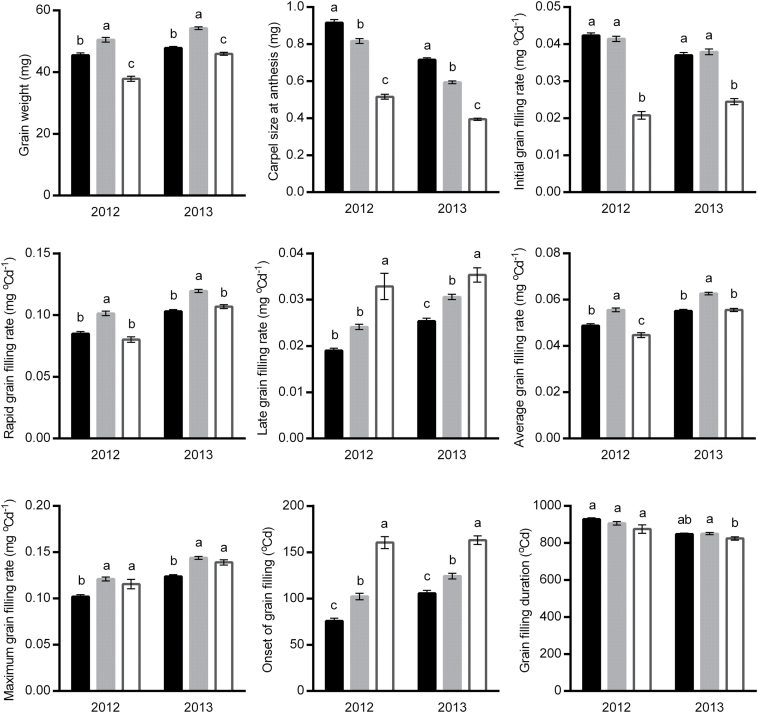
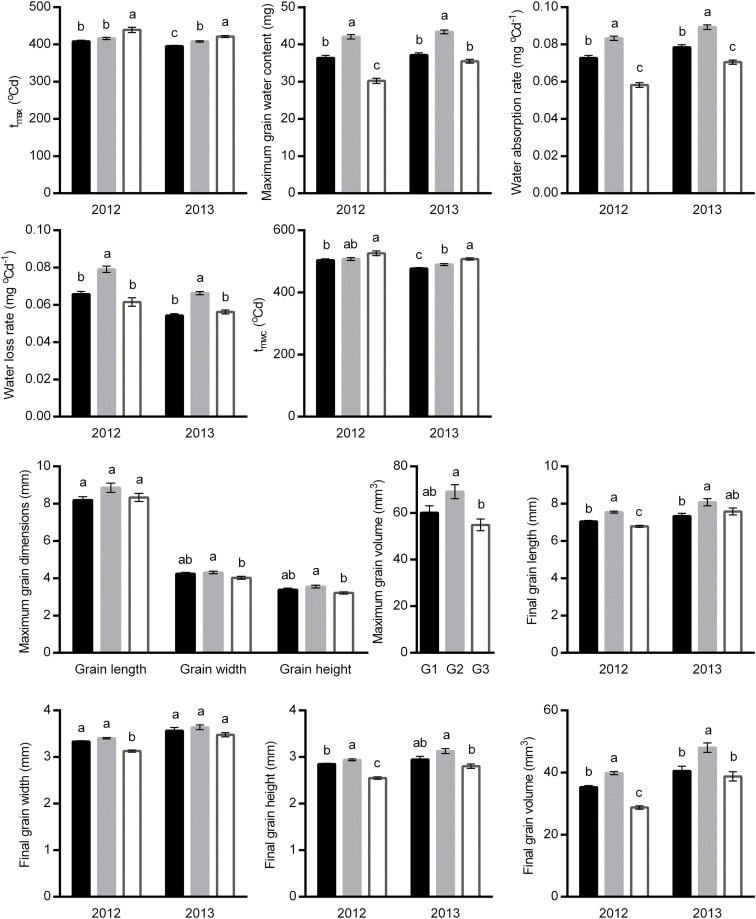
Fig. 6.
Comparisons of grain weight and grain filling traits between Grain 1, 2, and 3 within spikelets. Black, grey, and open bars (mean ±SEM) indicate Grain 1, 2, and 3, respectively. Different letters above the bars indicate significant differences between grain positions (P<0.01). Trait abbreviations: t max, time at the maximum grain filling rate; t mwc, time at the maximum grain water content. Comparisons of maximum grain dimensions were done in 2013 only.


