Fig. 3.
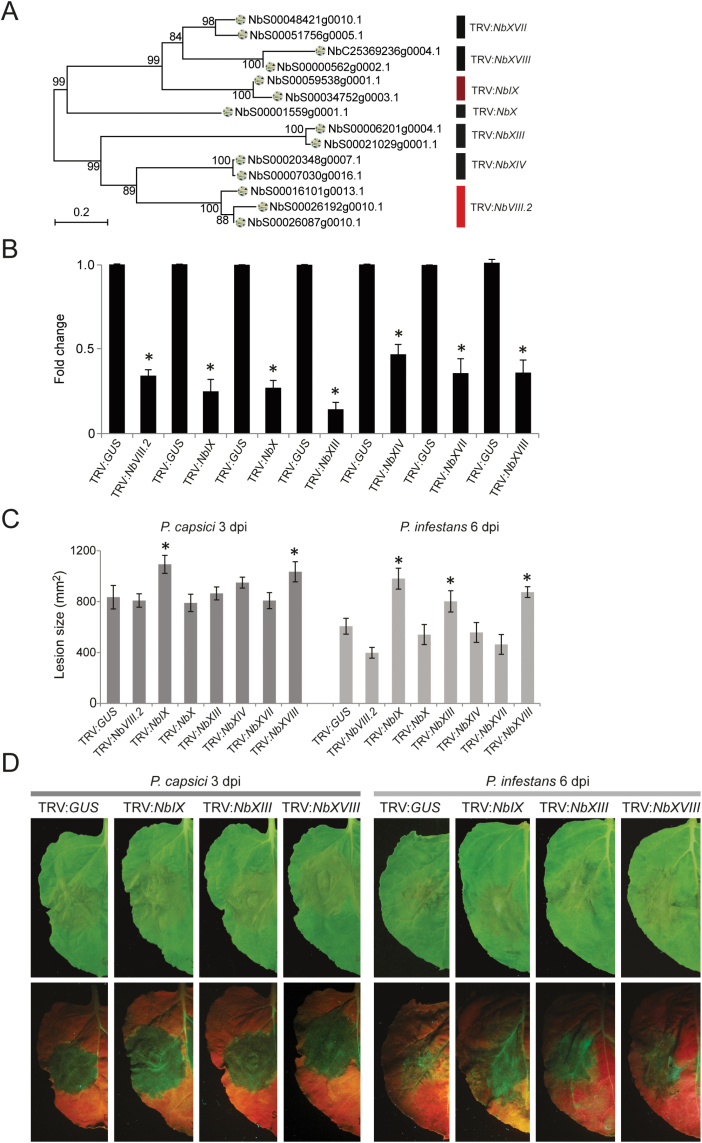
Response of NbLecRK-silenced N. benthamiana to Phytophthora infection. (A) NbLecRKs targeted by different TRV constructs. Colours refer to clades as represented in Table 1. (B) Relative NbLecRK transcript levels in TRV:GUS- and TRV:NbLecRK-treated N. benthamiana leaves. Transcript levels were normalized with NbActin and expressed as mean fold changes across four biological replicates (±SD) relative to the transcript level in TRV:GUS-treated leaves, which was arbitrarily set as 1. * indicates significant difference in expression levels (P<0.05, two-tailed t-test) between TRV:GUS- and TRV:NbLecRK-treated plants. (C) Lesion sizes on TRV:GUS- and TRV:NbLecRK-treated N. benthamiana leaves upon inoculation with P. capsici LT263 (1×10⁵ zoospores ml–1) and P. infestans 14-3-GFP (5×10⁵ zoospores ml–1) at 3 and 6 dpi, respectively. Bars represent mean lesion sizes (±SE) of over 20 inoculation sites from six independent plants. * indicates significant difference in lesion sizes (P<0.05, two-tailed t-test) between TRV:GUS- and TRV:NbLecRK-treated plants. This experiment was repeated four times with similar results. (D) Disease symptoms on TRV:GUS-, TRV:NbIX- TRV:NbXIII-, and TRV:NbXVIII-treated N. benthamiana leaves after inoculation with P. capsici at 3 dpi and P. infestans at 6 dpi. The pictures in the bottom row were taken under UV light. (This figure is available in colour at JXB online.)

