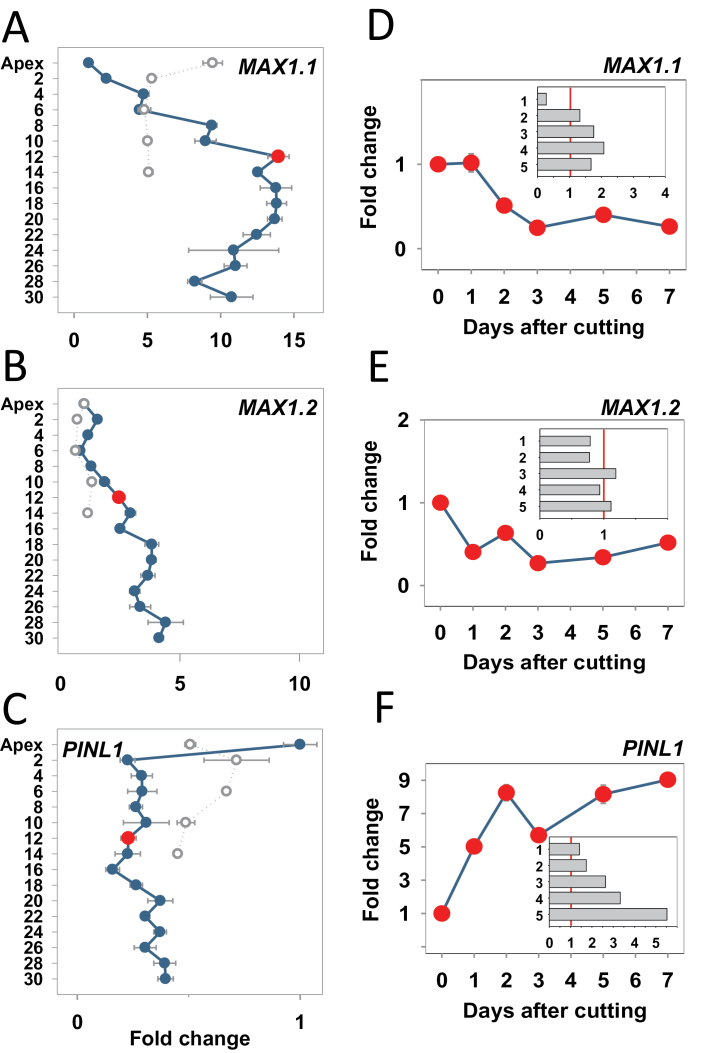
Fig. 8.
Expression analysis of genes of the strigolactone and auxin pathways in plants grown under long and short photoperiods and after stem decapitation. (A and D) MORE AXILLARY BRANCHES1 (MAX1.1); (B and E) MAX1.2; (C and F) PINFORMED1 (PINL1). (A–C) Intact plants grown under long days (LD; blue dots and lines) and for 5 weeks under short days (SD; open circles, stippled lines). Long-day samples include the apex and axillary buds (AXBs) until node 30 and short-day samples include the terminal bud and AXBs up to node 14. The red dot indicates the expression level (fold change on the x-axis) in AXB 12 of intact plants, the bud maturation point (BMP). (D–F) Stems were cut above the BMP and gene expression was followed for 7 d in AXB 12. Inserts indicate relative expression in five successive AXBs (1–5) proximal to the cut 8 d after decapitation (y-axis fold change). Values in A–C are calculated relative to the apex (set at 1). Values in D–F are relative to AXB 12 of intact plants (set at 1, red dot in A–C). Values in the insets of D–F are relative to each individual AXB position in the intact plants (set at 1, red line). Values represent the means of six plants ±SE, analysed in two pooled samples.

