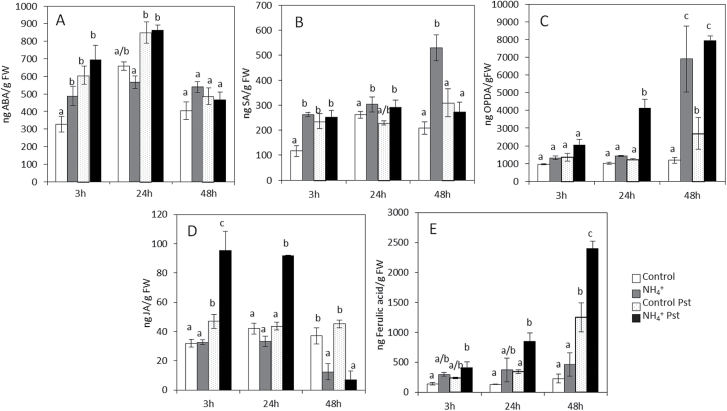
Fig. 5.
Hormonal profile in control and the N-NH4 + tomato plants upon Pst infection. Plants were grown and inoculated as described in Fig. 2. Leaves were collected at different time points, and ABA (A), SA (B), OPDA (C), JA (D), and ferulic acid (E) levels were determined by HPLC–MS. The concentration of the hormones was determined in all samples by normalizing the chromatographic area for each compound with the fresh weight of the corresponding sample. Data show the average of three independent experiments of a pool of 20 plants per experiment ±SE. Letters indicate statistically significant differences at each time point (P<0.05; least-significant difference test).

