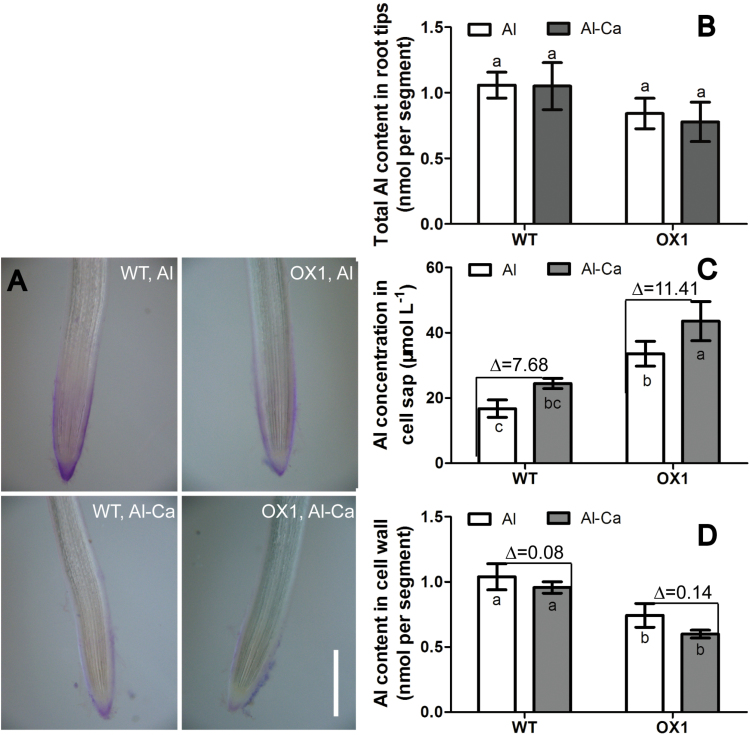
Fig. 4.
Changes in Al accumulation in recovery treatments. Five-day-old seedlings of WT or OX1 were transferred to Al or Al-Ca treatments (see Materials and methods). Root tips (0–10mm) were excised for determination. (A) Eriochrome Cyanine R staining. Bar, 500 μm. (B) Total Al content. (C) Cell wall Al content. (D) Cell sap Al content. Data are means±SE (n=3). The symbol ‘∆’ in C and D indicates the difference between Al treatment and Al-Ca treatment. Means with different letters are significantly different (P<0.05, Tukey’s test). (This figure is available in colour at JXB online.)

