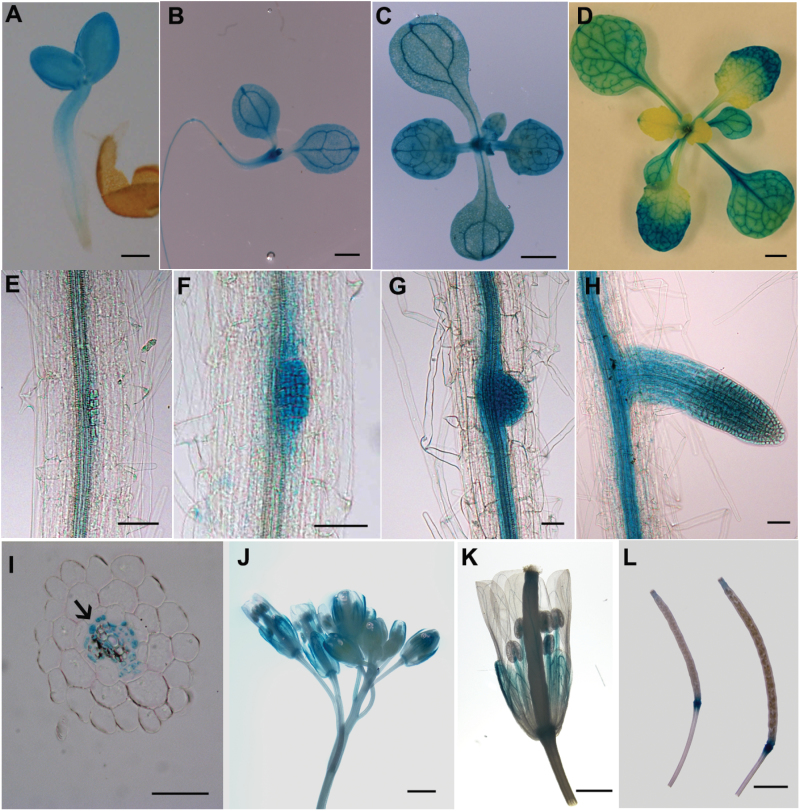
Fig. 3.
The expression pattern of AtLSG1-2. pAtLSG1-2::GUS expression was detected in 2- (A), 8- (B), and 12-d-old seedlings (C); 26-d-old soil-grown plant (D); LRs at stage A (E), C (F, G), and D (H); inflorescence (J, K); and siliques (L). (I) Transverse section of GUS-stained primary roots. Arrow indicates the xylem. Ten GUS-positive transgenic plants were checked and similar expression patterns were observed. A representative image is shown. Scale bars, 100 µm (A), 1mm (B–E), 50 µm (F–I), and 500 µm (J– L).

