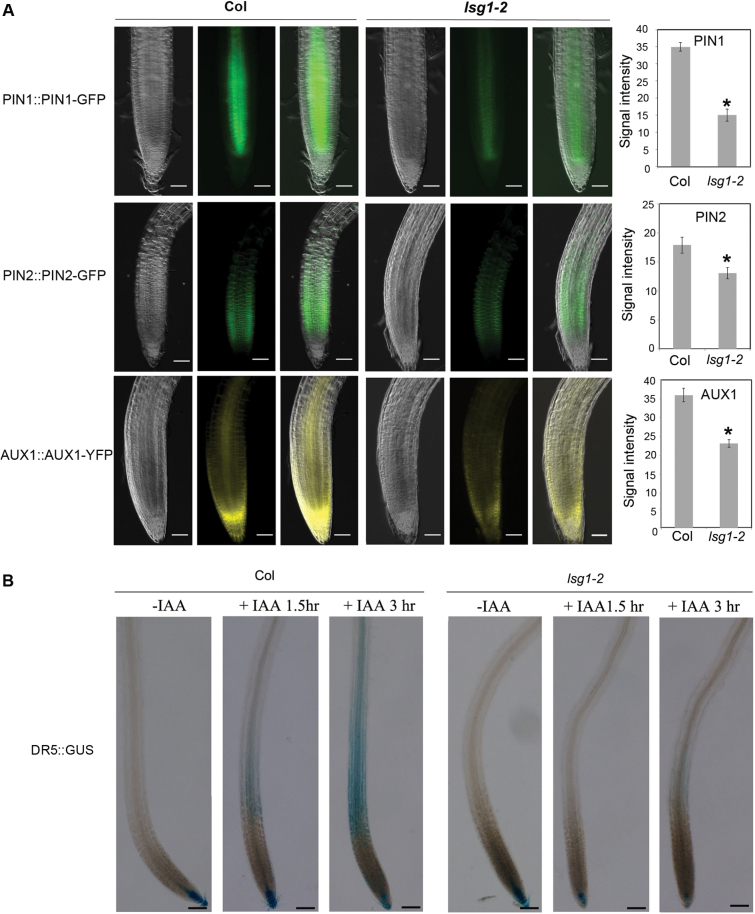
Fig. 8.
The lsg1-2 mutant has reduced levels of auxin transporters and displays auxin transport defects. (A) Expression of pPIN1::PIN1-GFP, pPIN2::PIN2-GFP, and pAUX1::AUX1-YFP in roots of Col-0 and lsg1-2, and quantification of the fluorescence intensity. For each genotype- reporter, the left panel presents a bright-field image of the root; the middle panel presents the GFP or YFP image; and the right panel shows the merged image of bright-field and GFP/YFP images. Scale bars, 50 µM. Fluorescence intensities were quantified using Image J. Data represent means ± standard error (n = 10). *P<0.01 (t-test) compared with wild-type plants. (B) The auxin transport process was monitored using DR5::GUS reporter in wild-type (Col-0) and lsg1-2 mutant roots. Root tips were treated with IAA for 1.5 or 3h. Roots were then stained for reporter gene expression. Scale bars, 100 µM. At least 10 plants were examined with similar results. Representative images are shown.

