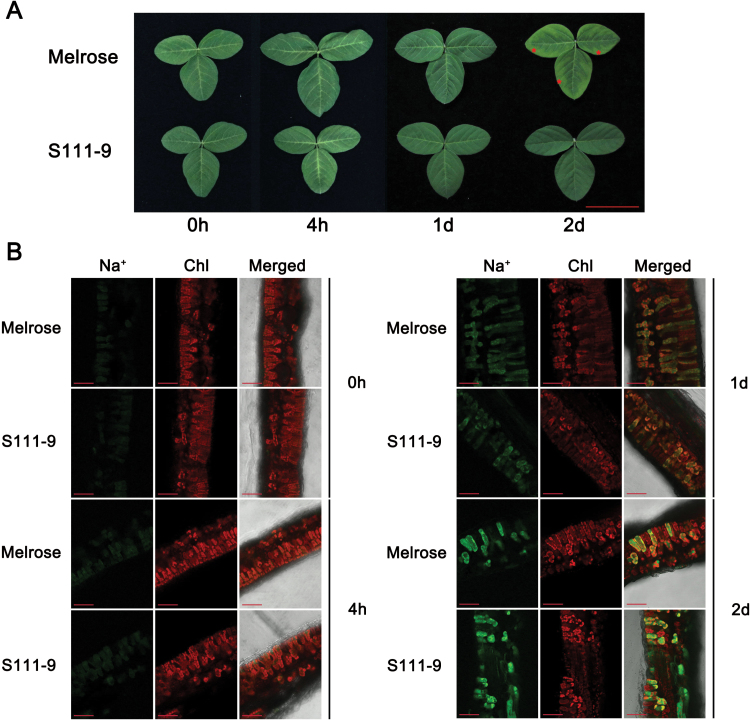
Fig. 1.
Effects of salt stress on phenotype and the distribution of Na+ in soybean leaves. (A) Phenotypes of the third leaves in Melrose and S111-9 under 150mM NaCl stress for 0h, 4h, 1 d, and 2 d. Scale bar=5cm. (B) Cellular localization and distribution of Na+ in Melrose and S111-9 under 150mM NaCl stress for 0h, 4h, 1 d, and 2 d. The third leaves of 25-day-old plants were sectioned and stained with CoroNa Green AM to report Na+ concentration. All sections were observed at ×20 magnification. Scale bars=50 μm.

