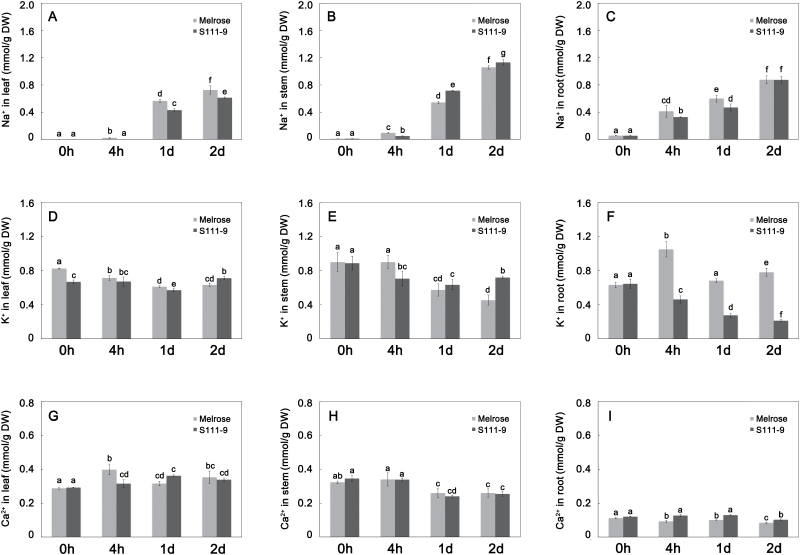
Fig. 2.
Effects of salt stress on Na+, K+, and Ca2+ in leaf, stem, and root. Concentrations of Na+ (A–C), K+ (D–F), and Ca2+ (G-I) in leaf (A, D, G), stem (B, E, H), and root (C, F, I). The concentrations of Na+, K+, and Ca2+ were measured in dry samples by ICP-MS. All data were normalized to calculated weights, as determined with the solution concentrations. Bars represent the mean ±SD of at least three independent experiments. Different letters indicate significantly different values (P<0.05) by Tukey’s test.

