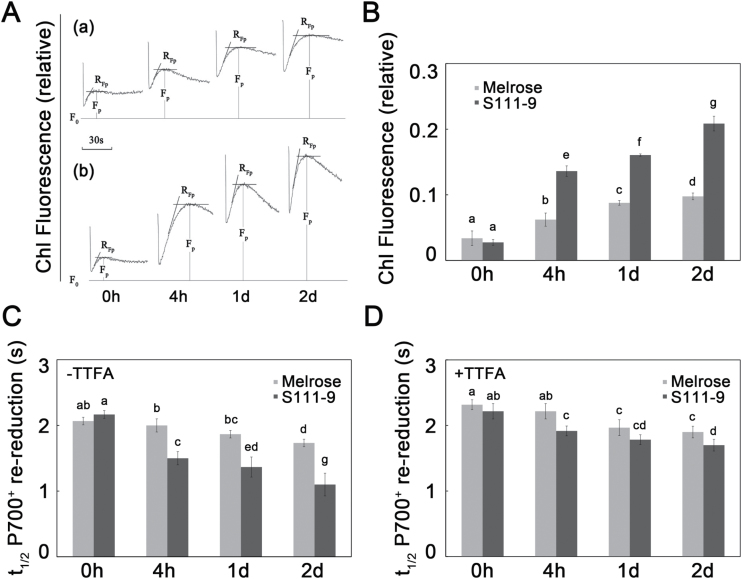
Fig. 3.
Effects of salt stress on NDH-dependent CEF activity. The third fully expanded leaves of Melrose and S111-9 under 150mM salt stress for 0h, 4h, 1 d, and 2 d were used in this experiment after 30min dark adaptation. (A) A typical post-illumination transient increase induction curve in Melrose (a) and S111-9 (b) under 150mM salt stress. F 0, dark fluorescence level; F p, the height of the post-irradiation fluorescence increase. (B) The effects of salt stress on the post-illumination fluorescence increase in Melrose and S111-9. (C) The effects of salt stress on the t 1/2 of P700+ re-reduction. The typical trace of the dark re-reduction of P700+ was measured following illumination by far red light (>705nm, 6 μmol m–2 s–1) in the absence of 100 μM TTFA (an inhibitor that binds ferredoxin). (D) The effects of salt stress on the t 1/2 of P700+ re-reduction in the presence of 100 μM TTFA. Bars represent the mean ±SD of six independent experiments. Different letters indicate significantly different values (P<0.05) by Tukey’s test.

