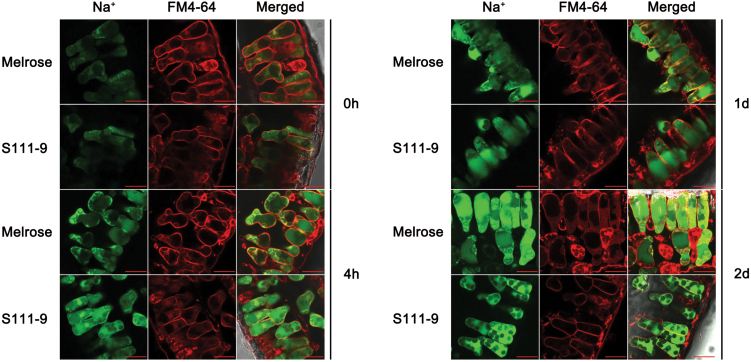
Fig. 6.
Distribution and accumulation of Na+ in soybean leaves. Comparison of the distribution and accumulation of Na+ in the leaves of Melrose and S111-9 treated with 150mM salt for 0h, 4h, 1 d, and 2 d. Confocal images of leaf sections stained with CoroNa Green (green) and FM4-64 (red) are shown. CoroNa Green fluorescence intensity indicates the Na+ content. FM4-64 is an endocytotic marker dye that is internalized to the tonoplast via the endosomal compartment, and red fluorescence indicates the location of the vacuole. All sections were observed at ×63 magnification. Scale bars=20 μm.

