Fig. 2.
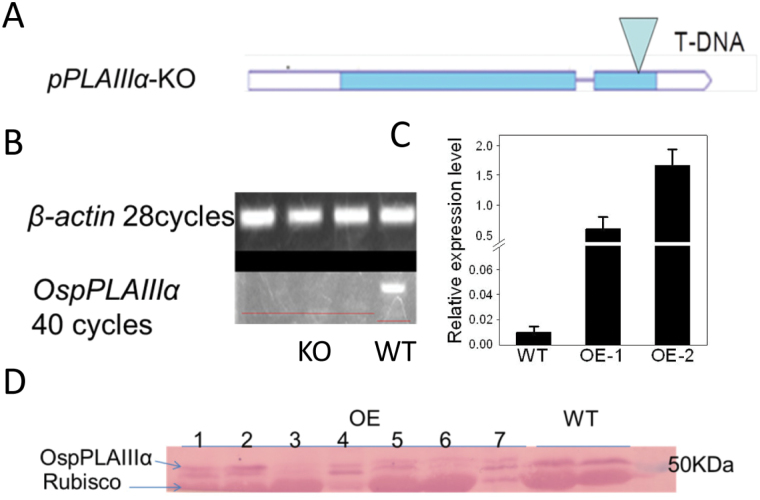
OspPLAIIIα T-DNA insertion mutant and overexpression in rice. (A) Schematic map showing the T-DNA insertion location (PEG_3A-11040.R) in OspPLAIIIα. (B) PCR verification of the OspPLAIIIα transcript level in the mutant. RNA was extracted from the same stage rice leaves from mutant and wild-type seedlings grown in a greenhouse. The RNA level was normalized to that of β-actin. (C) Transcript level of OspPLAIIIα in wild-type and overexpressing leaves at the tillering stage. The transcript level was measured by real-time PCR and normalized to the level of β-actin. Values are means ±SD (n=3). (D) Immunoblotting of pPLAIIIα in overexpressing and wild-type rice leaves. pPLAIIIα was fused to a Flag tag and, after SDS–PAGE separation, protein was immunoblotted with anti-Flag antibodies and visualized by alkaline phosphatase activity. The upper band was unique to OE transgenic plants.

