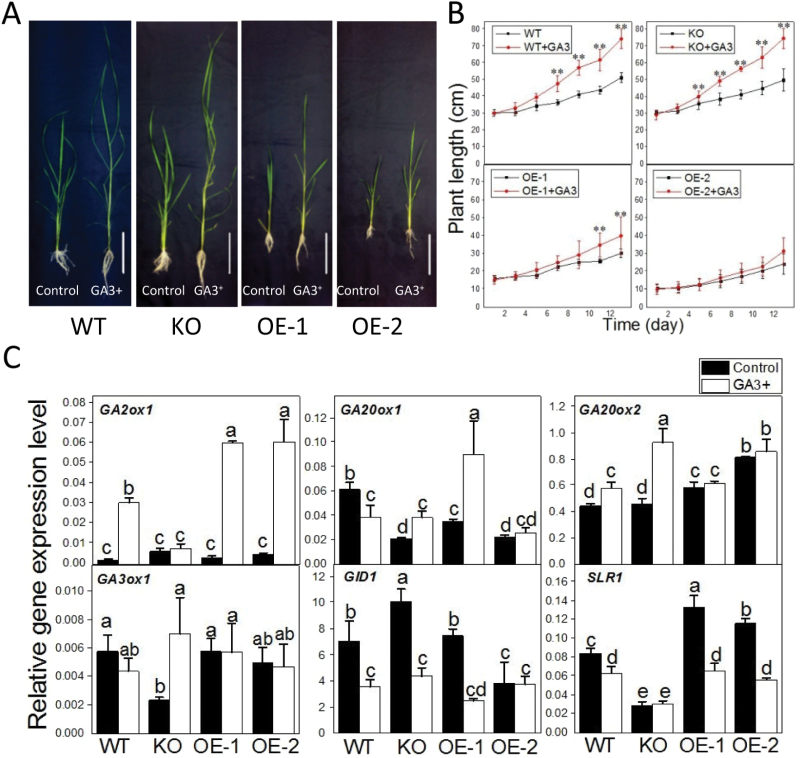
Fig. 7.
The involvement of OspPLAIIIα in gibberellin (GA) response. (A) The growth response of WT, KO, and OE seedlings grown in liquid medium without and with 500 μM GA3 for 14 d. (B) The plant height of OspPLAIIIα-alterated seedlings treated with and without GA3 for 14 d. Values are means ±SD (n=6). (C) Transcript level of genes involved in GA synthesis, degradation, and response. The level was measured by real-time PCR and normalized to β-actin. a, b, c, and d indicates different expression levels between treated and untreated plants within each genotypes according to ANOVA, P<0.05. Values are means ±SD (n=3). (This figure is available in colour at JXB online.)

