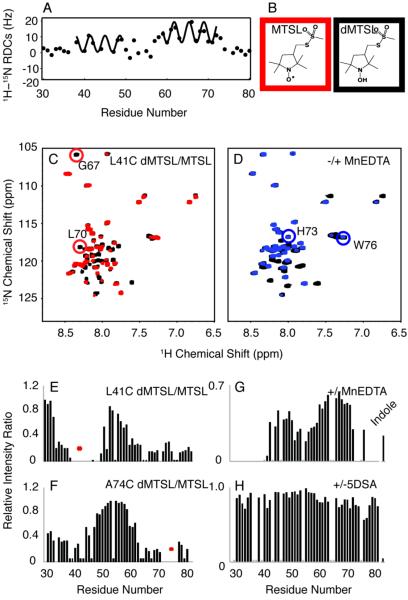
Figure 8. Solution NMR measurements for structure calculation of VpuCyto in DHPC micelles.
A. Plot of residual dipolar couplings as a factor of residue numbers obtained from weakly aligned sample in 6% polyacrylamide stretch gel. B. Chemical structure of MTSL (red box) and its reduced form (black box). C. Overlap of 1H-15N HSQC spectra of L41C VpuCyto with MTSL label (red) and its reduced diamagnetic label (black). D. Overlap 1H-15N HSQC spectra of VpuCyto with MnEDTA (blue) and without MnEDTA (black). E. Intensity plot shows PRE intensity ratio (Ipara/Idia) for L41C VpuCyto. F. Intensity plot shows PRE intensity ratio (Ipara/Idia) for A74C VpuCyto. G. Intensity change measured before and after addition of MnEDTA. H. Intensity change measured before and after addition of 5SDA to VpuCyto in DHPC micelles.

