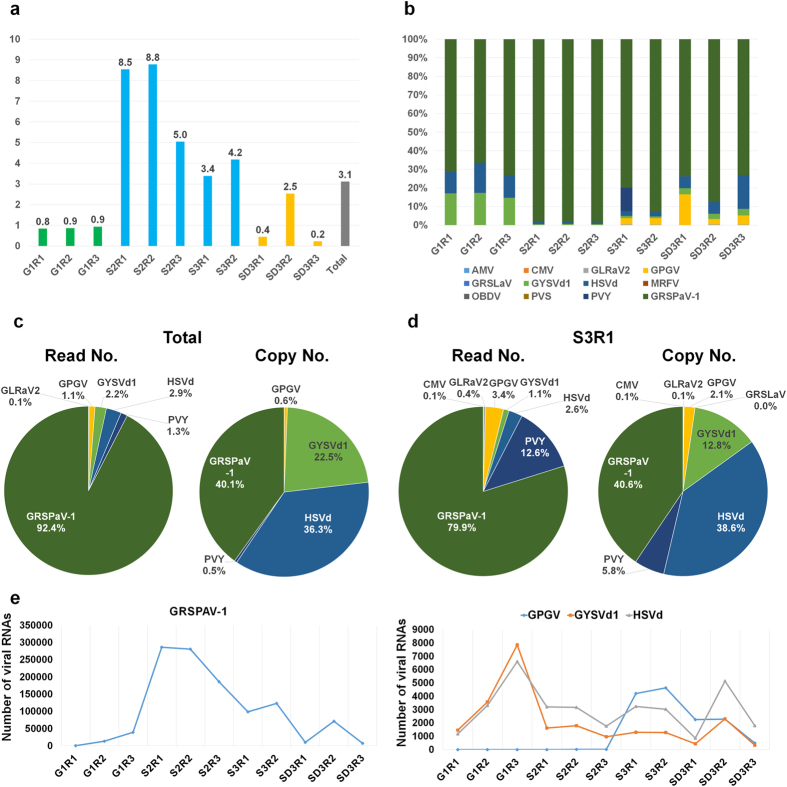
Figure 2. The amount of viral RNAs and the viral RNA copy numbers in the grapevine transcriptome.
(a) The percentage of viral RNAs calculated based on the number of virus-associated reads divided by the number of total sequenced reads in each sequenced library. (b) The relative ratio of individual identified viruses or viroids in each library based on virus-associated reads. (c) The percentage of identified viruses and viroids based on virus-associated reads and virus copy numbers in the 11 libraries. (d) The percentage of identified viruses based on virus-associated reads and virus copy numbers in the S3R1 library. (e) The amount of viral RNAs for GRSPAV-1, GPGV, GYSVd1 and HSVd in each library based on the virus copy number.

