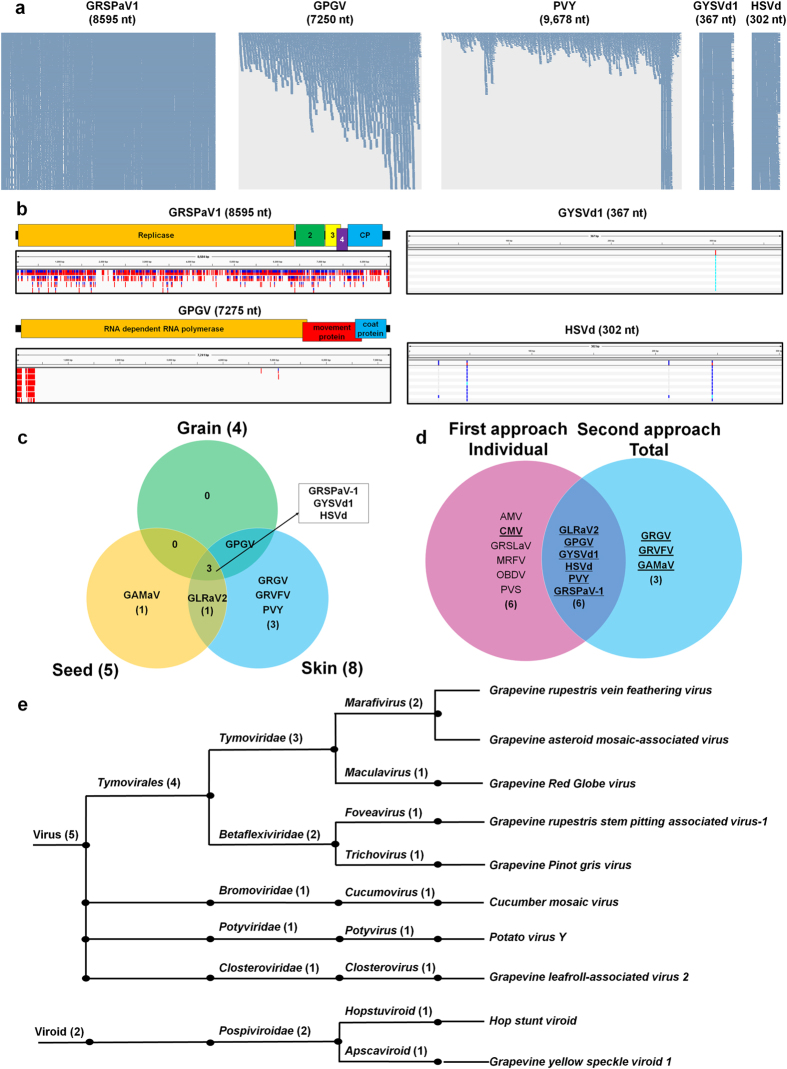
Figure 5. Study of single nucleotide variations and classification of identified viruses and viroids.
(a) Visualisation of aligned reads on the five viral genomes. (b) The various coloured bars indicate the identified SNVs along the genome of each virus or viroid. The number in the coloured box for GRSPaV1 indicates the genes that encode 24.4 kDa, 12.8 kDa and 8.4 kDa proteins. (c) A comparison of the viruses and viroids identified from the three different tissues. (d) A comparison of the identified viruses and viroids using the two different approaches. The viruses and viroids with underlined, bold characters were then selected. (e) Classification of the identified viruses and viroids according to taxonomy.

