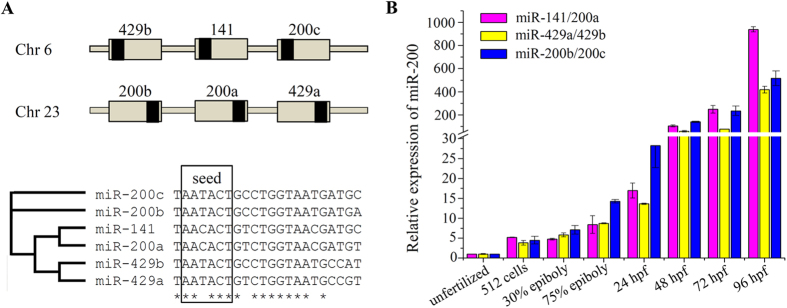
Figure 1. Genomic organization and expression pattern of zebrafish miR-200 family members.

(A) Schematic illustration of genomic organization and multiple alignments of two miR-200 clusters. Grey boxes represent the pre-miRNAs and black boxes represent the mature miRNAs. (B) Expression of miR-200s during embryonic development. Error bars indicate mean ± SD, n = 3.
