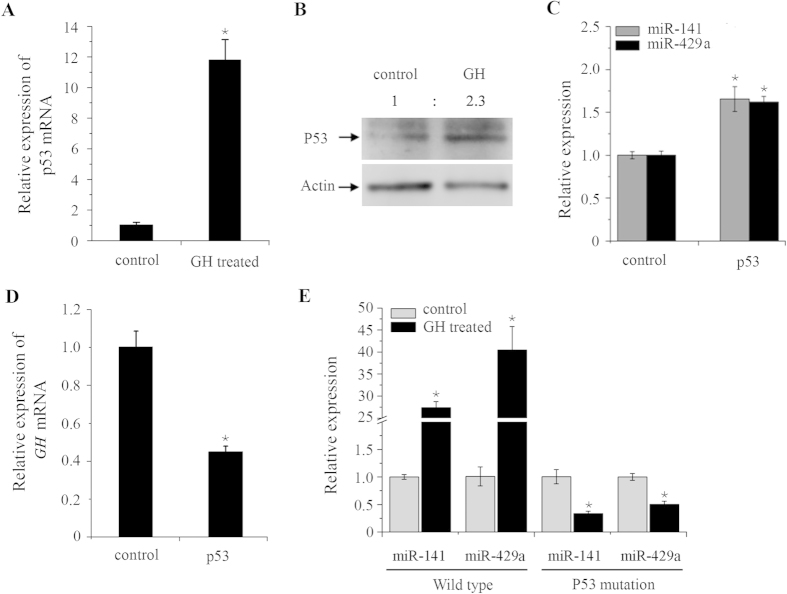
Figure 6. GH activates miR-200s expression in a p53-dependent manner.
(A) Increased expression of p53 mRNA by GH overexpression. (B) Increased expression of p53 protein by GH overexpression. Numbers indicate quantification of the P53 band densities relative to actin. (C) Increased expression of miR-141 and miR-429 at 24 hpf embryos when injected with p53 mRNA. (D) Decreased expression of GH at 24 hpf embryos when injected with p53 mRNA. (E) The expression of miR-141/200a and miR-429a/b in wild-type and p53 mutation embryos when GH was overexpressed. Nanopure water injected embryos as a control. (A,C–E) Error bars indicate mean ± SD, n = 3. Student’s t-test was used for statistical analysis (*p < 0.05).

