
Fig. 1.
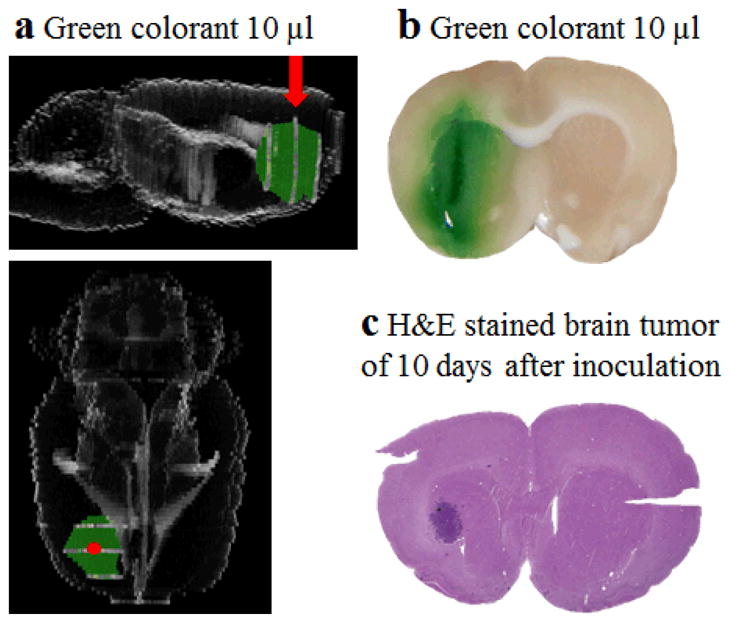
Distribution of green colorant after injection by CED in rat brain. (a) Side view and upper view of 3D reconstruction of rat brain and green colorant (red arrow and red dot indicate injection point). (b) Distribution of green colorant from the injection site 30 min after CED. (c) H&E staining of brain tumor 10 days after inoculation of F98 cells.