
Figure 1. Effects of CuO NPs on the variations of NO3−-N (solid, A), NO2−-N (hollow, A) and N2O-N (B) during 24 h exposure tests.
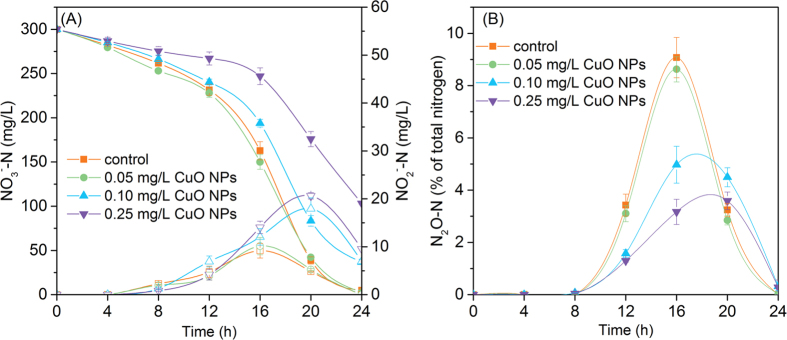
Error bars represent standard deviations of triplicate measurements.
Official websites use .gov
A
.gov website belongs to an official
government organization in the United States.
Secure .gov websites use HTTPS
A lock (
) or https:// means you've safely
connected to the .gov website. Share sensitive
information only on official, secure websites.
Error bars represent standard deviations of triplicate measurements.