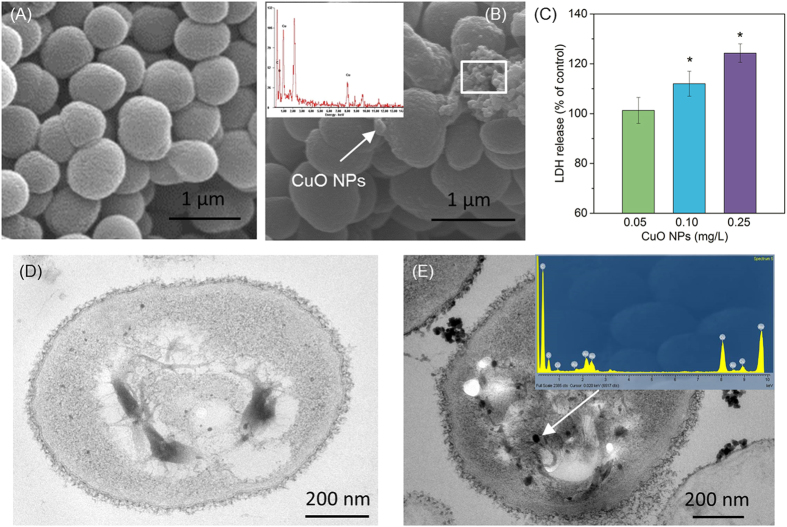
Figure 2. Effect of CuO NPs on cellular structure of P. denitrificans.
SEM image of bacteria (A), SEM image and EDS analysis of bacteria exposed to 0.25 mg/L CuO NPs (B), LDH release of bacteria exposed to different CuO NPs dose (C), TEM image of bacterial cell without CuO NPs exposure (D), and TEM image and EDS analysis of cells exposed to 0.25 mg/L CuO NPs (E).

