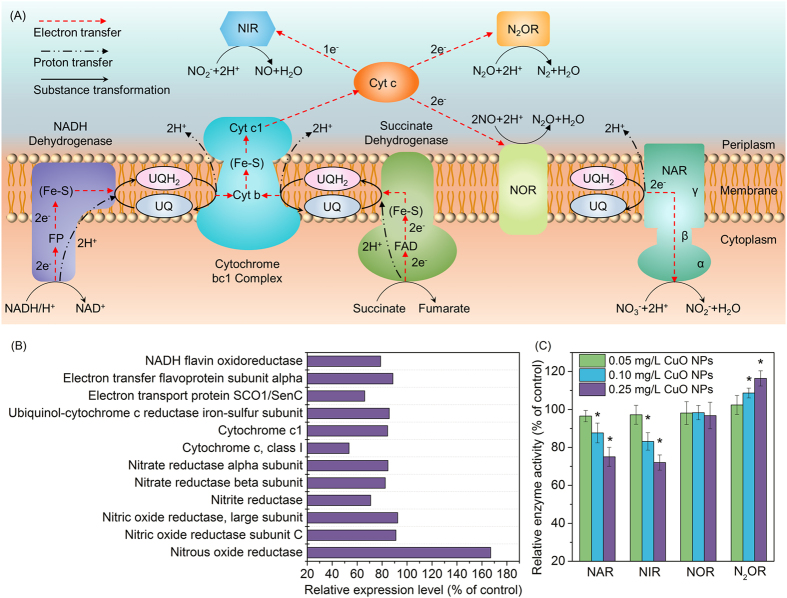
Figure 6. Illustration of electron transfer and substance transformation in denitrification process (A), the relative expression level of proteins involved in denitrification (B), the effects of CuO NPs exposure on the activities of NAR, NIR, NOR, and N2OR at time of 24 h (C).
Error bars represent standard deviations of triplicate measurements, and asterisks indicate significant reduction compared to control samples (p < 0.05).

