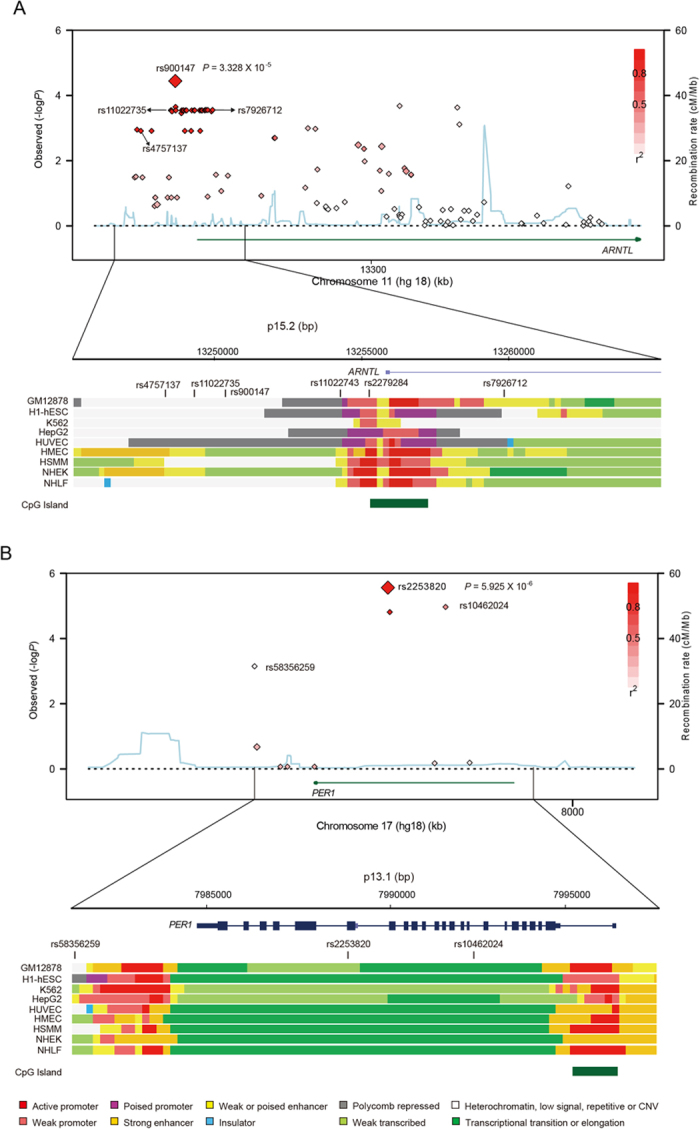
Figure 2. Regional plots of association results, recombination rates and chromatin state segmentation tracks for ARNTL and PER1.

(A,B) Results for ARNTL (A) and PER1 (B), respectively. Plots show the association results of both genotyped and imputed SNPs in the studied samples and their recombination rates. log10 P-values (y axes) of the SNPs are shown according to their chromosomal positions (x axes). The lead SNP in each combined analysis is shown as a large diamond and labelled by its rsID and P-values. The colour intensity of each symbol reflects the extent of LD with the lead SNP, white (r2 = 0) through to dark red (r2 = 1.0). Genetic recombination rates, estimated using CHB+JPT samples from 1,000 genomes, are shown with a light blue line. Physical positions are based on hg18 of the human genome. The relative positions of genes and transcripts mapping to the region of association are also shown. Genes have been redrawn to show their relative positions. Below each plot is a diagram of the exons and introns of the genes and SNPs of interest. The chromatin state segmentation track (ChromHMM) for 9 studied cell lines was derived from the ENCODE project (UCSC genome browser). The CpG island is shown at the bottom of each plot.
