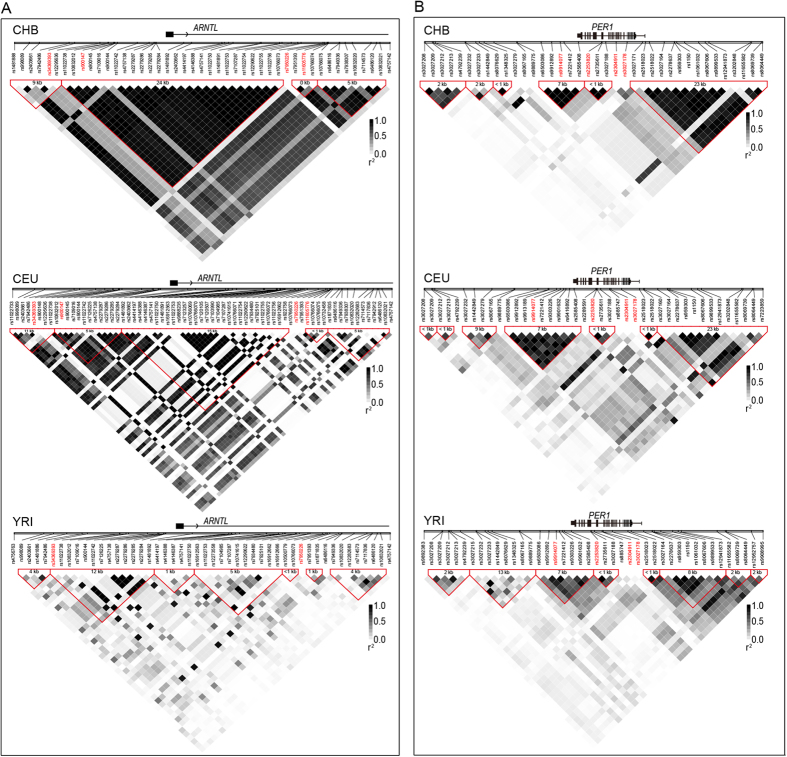
Figure 3. Linkage disequilibrium (LD) blocks the most significantly associated SNPs in ARNTL (rs990147) and PER1 (rs2253820) in 3 HapMap populations.
HapMap Phase II+III data surrounding (approximately 50 kb) rs990147 (panel A) and rs2253820 (panel B) were used to construct LD blocks of CHB (Han Chinese in Beijing, China), CEU (Utah residents with Northern and Western European ancestry from the CEPH collection) and YRI (Yoruba in Ibadan, Nigeria) using Haploview software. SNPs with minor allele frequency >0.1 were used to calculate the r2 and to construct the LD block. From the top to bottom of each diagram are genes and their relative positions, relative positions of SNPs on the x-axis, ID of each SNP, LD block and their size, and r2 values of paired SNPs, which were represented as squares with colour inside, white (r2 = 0) to black (r2 = 1.0). The relative positions of SNPs are according to their physical position on the chromosome and are labelled with vertical bars. The LD block was determined using confidence intervals (CIs) and was labelled with red triangles. The block size was determined by the distance of border SNPs and annotated in each block. Tagging SNPs are labelled in red.

