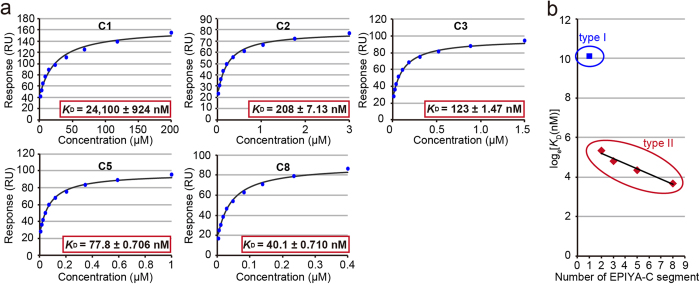
Figure 2. Quantitative study of CagA-SHP2 interaction.
(a) Surface plasmon resonance (SPR) analysis was performed using tyrosine-phosphorylated CagA containing a variable number of EPIYA-C segments (C1, C2, C3, C5, and C8) and the N-terminal SHP2 fragment containing two SH2 domains (SHP2/SH2). Equilibrium dissociation constant (KD) of CagA-SHP2 complex was determined by a Scatchard plot, which indicates the amount of bound at each concentration of SHP2/SH2 (Mean ± SEM, n = 3). (b) The logarithmic value of KD in each number of EPIYA-C segments was plotted and regression line was calculated. A blue spot means KD of binding of SHP2/SH2 to CagA with a single EPIYA-C segment (type I Western CagA, circled in blue) whereas red spots represent KD values of binding of SHP2/SH2 to CagA with multiple EPIYA-C segments (type II Western CagA, circled in red).

