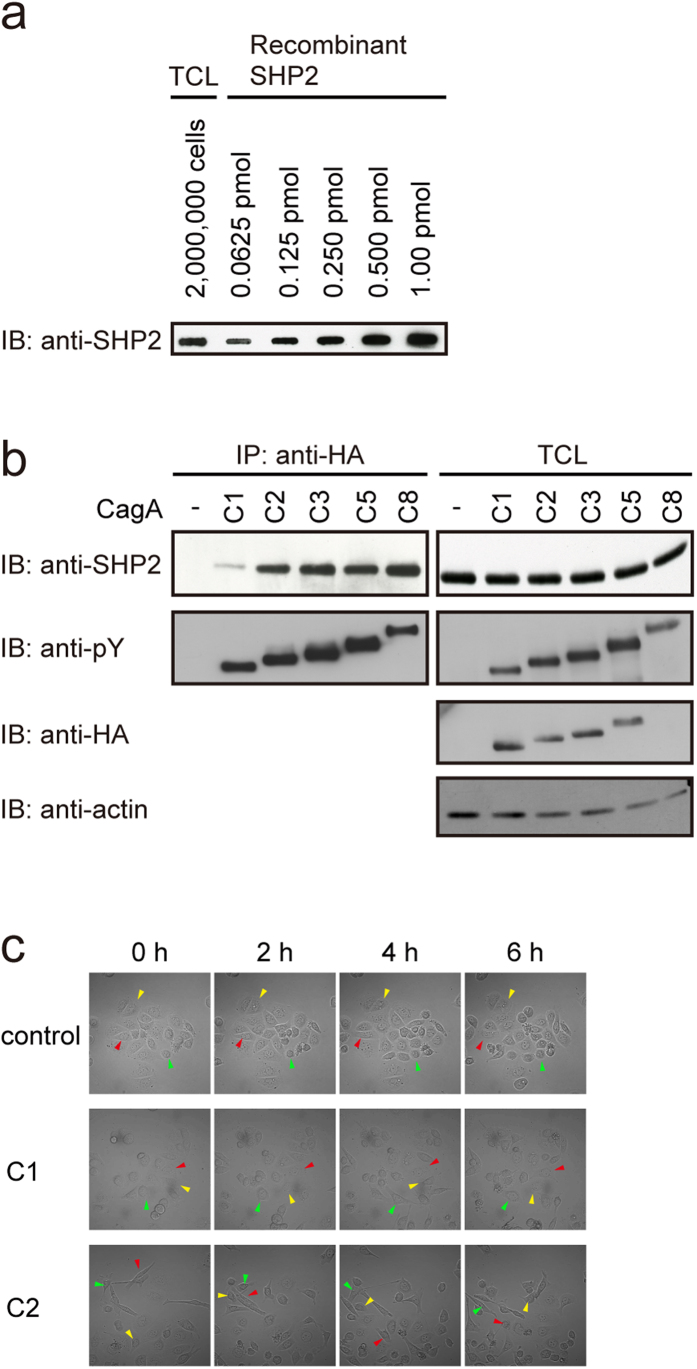
Figure 3. Complex formation between SHP2 and CagA containing a variable number of EPIYA-C segments in gastric epithelial cells.
(a) Total cell lysates (TCLs) prepared from AGS gastric epithelial cells (2 million cells) and a series of diluted recombinant SHP2 samples were subjected to an immuno-dot blot assay with an anti-SHP2 antibody. The intracellular concentration of SHP2 in AGS cells was calculated by quantifying intensities of each SHP2 bands with a luminescence image analyzer. (b) AGS cells were transiently transfected with an expression vector for an HA-tagged CagA containing a variable number of EPIYA-C segments (C1, C2, C3, C5, or C8). At 24 h after transfection, TCLs were prepared and subjected to immunoprecipitation with an anti-HA antibody. The anti-HA immunoprecipitates (IP) and TCLs were subjected to immunoblotting (IB) with the indicated antibodies. (c) AGS cells were transfected with an expression vector for CagA-ABC (C1) or CagA-ABCC (C2). At 12 h after transfection as a starting point for time-lapse imaging, cell migration were observed at 3-min intervals for 6 hours by differential interference contrast microscopy. Images every 2 hours were shown. Arrowheads of the same color (red, yellow, or green) indicate the positions of the same cell during the time course. See also S1–S3 Movies.

