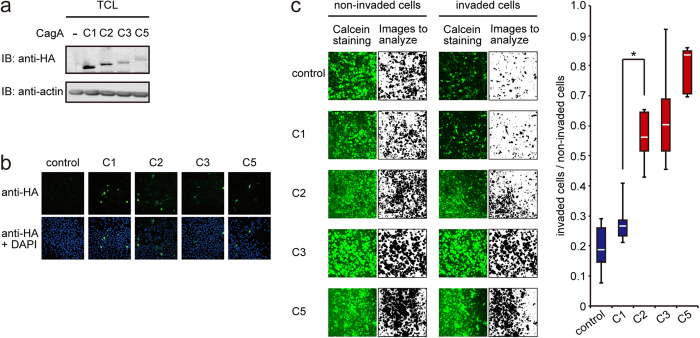
Figure 4. Invasion assay of gastric epithelial cells expressing CagA with a variable number of EPIYA-C segments.
AGS cells transiently transfected with an expression vector for an HA-tagged CagA containing a variable number of EPIYA-C segments (C1, C2, C3, or C5) were subjected to invasion assay. (a) Expression of each CagA proteins in transfected cells was determined by immunoblotting. (b) Expression of each CagA proteins in transfected cells was examined by immunostaining using an anti-HA antibody (green). Nuclei were also stained with DAPI (blue). (c) Cells were stained by Calcein and the invading cell population and non-invading cell population were quantified using ImageJ software (black images for Calcein-stained cells) (left). The magnitudes of strength of invasion phenotype were determined by evaluating relative ratio of cells that passed through the filter to invade into collagen gel matrices (invaded cells) in regard to cells that didn’t pass through the filter (non-invaded cells) and are shown as box plots (right). *P < 0.01, Mann-Whitney u test.

