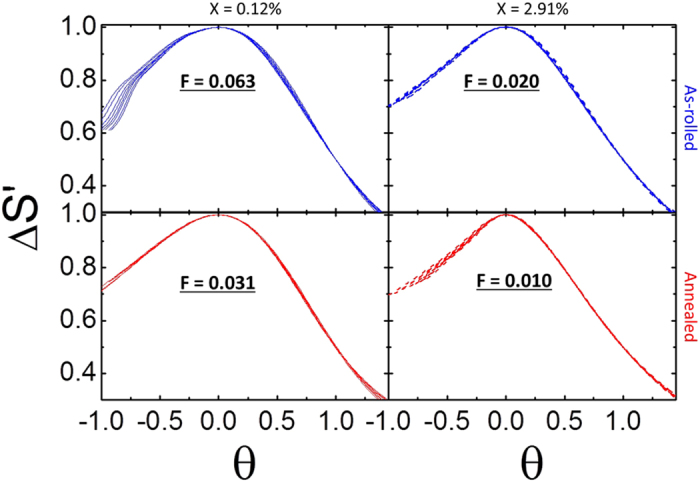
Figure 7. Scaled curves calculated from the ΔSM(ΔH,T) for the x = 0.12% (solid) and x = 2.91% (dashed) both as-rolled (blue) and annealed (red) for fields ranging from 15 to 50 kOe in steps of 5 kOe.

The F values indicate the level of homogeneity within the set of ten curves in each plot. Annealing and adding Pd both increase the magnetic homogeneity of the system; the greatest improvement utilized both.
