
FIGURE 2.
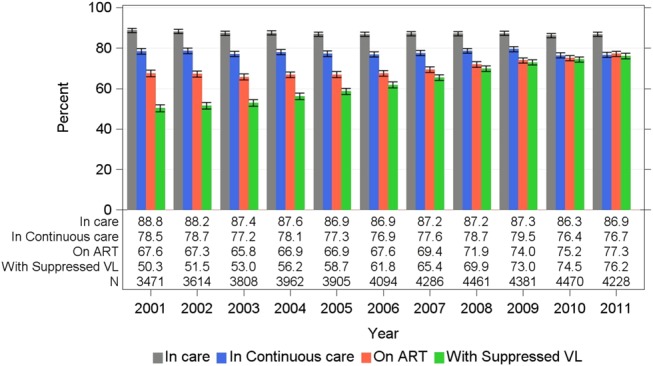
Proportion meeting HIV care engagement indicators among enrolled participants of the OHTN cohort study, 2001–2011. Proportions shown with 95% CIs. For each year and all indicators shown, the denominator included all participants ever enrolled and who had no record of death as of that year. In care: ≥1 viral load or CD4 cell count per year. In continuous care: ≥2 viral loads per year ≥90 days apart. On ART: initiated antiretroviral treatment in that year or earlier with no record of having stopped. With suppressed viral load: viral load <200 copies per milliliter. Figure 1 and text provide details.