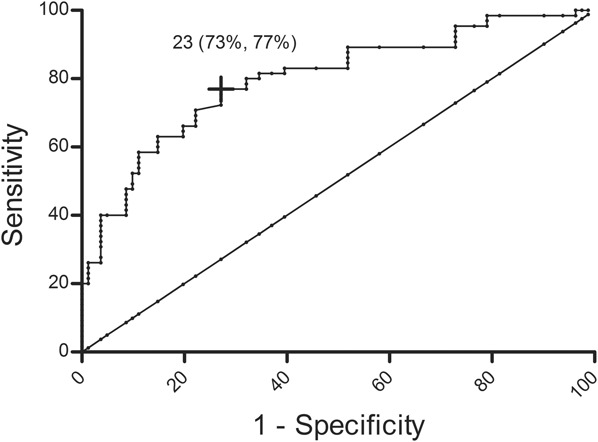
FIGURE 1.

Receiver operating curve of the clot lysis parameter AUC, patients with IBD + TE compared with HC. The clot lysis parameter AUC had an area under the receiver operating curve (95% CI) of 0.80 (0.73–0.87). The cross depicted in black presents the best top-left cutoff, 23 optical density × minutes, with a specificity of 73% and a sensitivity of 77%.
