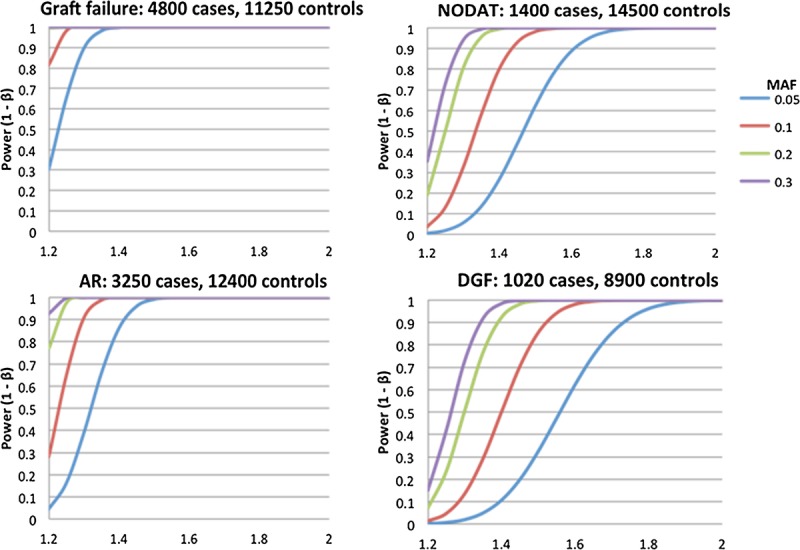
FIGURE 2.

Genome-wide statistical power calculations to detect main effects for the four main iGeneTRAiN phenotypes. Graft Survival in 4800 cases and 11,250 controls (top-left); AR in 3250 cases and 12,400 controls (bottom-left); NODAT in 1400 cases and 14,500 controls (top-right); DGF in 1020 cases and 8900 controls (kidney only) (bottom-right). The X-axes shows the OR effect size, and the Y-axes illustrate the statistical power to detect the main effects under different MAFs: 5%, 10%, 20%, and 30% shown in blue, red, green, and purple, respectively. Significance is assessed at 5% level using Bonferroni correction, assuming 500,000 SNP tests
