Fig. 4.

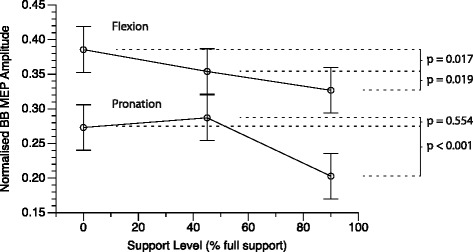
Predicted mean MEP amplitudes for flexion and pronation tasks plotted against WS level. Error bars represent standard error of the mean. Adjusted p-values for pairwise comparisons are indicated at right

Predicted mean MEP amplitudes for flexion and pronation tasks plotted against WS level. Error bars represent standard error of the mean. Adjusted p-values for pairwise comparisons are indicated at right