
Fig. 1.
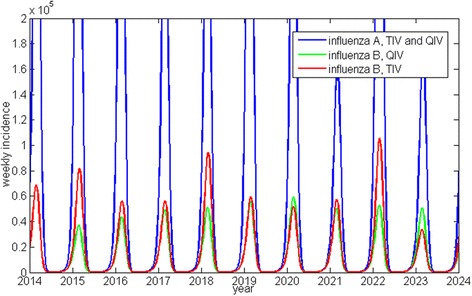
Comparison of a typical TIV-QIV pair of model simulations (example of Canada). Note: The seventh and tenth influenza B peaks are actually slightly higher with QIV than with TIV. This is because the model is stochastic; TIV and QIV versions diverge so there is no real 1:1 correspondence between seasons after the first season in which QIV is introduced; Since TIV and QIV have identical efficacy against influenza A, the evolution of influenza A incidence with the TIV and QIV is identical between the pair of simulations