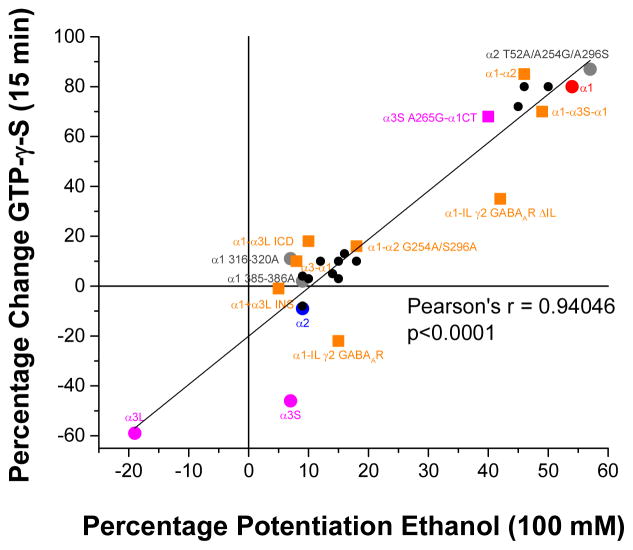
Figure 2. Ethanol sensitivity correlates with G protein modulation in GlyRs.
Correlation plot comparing the percentage of the potentiation of the glycine-evoked currents in the presence of ethanol (100 mM) and after 15 minutes of dialysis with GTP-γ-S. The correlation coefficient was highly significant, confirming the correlation between ethanol effects and Gβγ modulation for all GlyRs tested. We highlighted the WTs α1 (red), α2 (blue) and α3 (magenta), some relevant mutated (gray) and chimeric receptors (orange).

