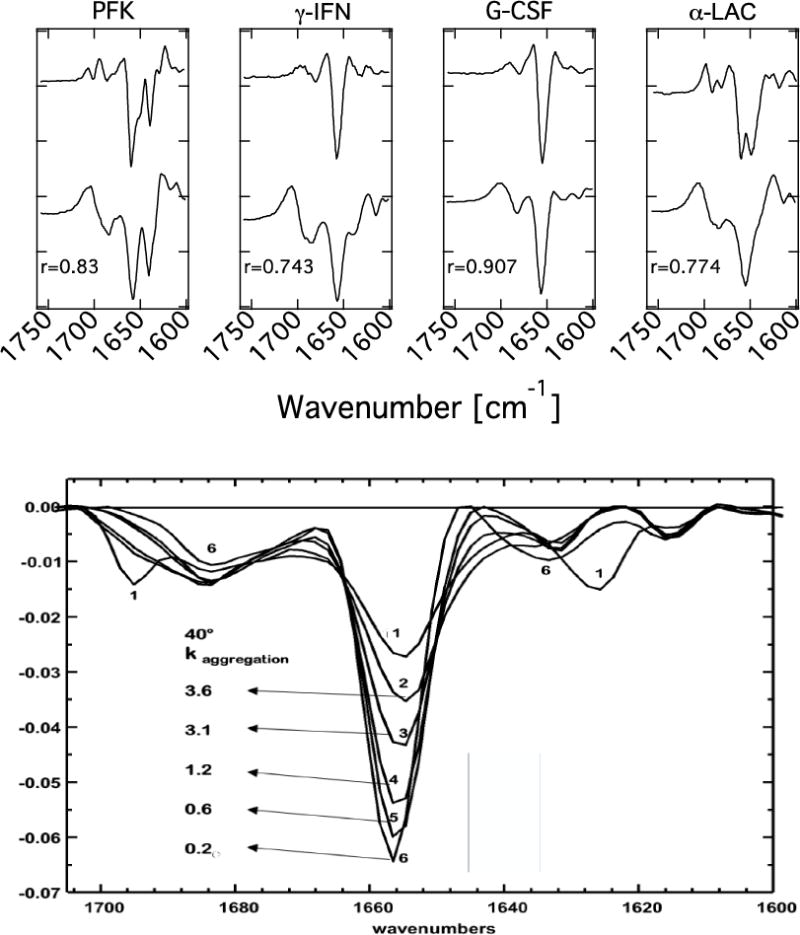
Fig. 1.

2nd Derivative FTIR data in the Amide I region: top) Solution spectra at top, spectra from freeze-dried proteins without stabilizers at bottom. PFK = phosphofructokinase; γ-IFN = gamma interferon; G-CSF = granulocyte-colony-stimulating factor. “r” is a spectral correlation coefficient [42,43]. bottom) Freeze-dried hGH spectra and rate constants for aggregation at 40 °C. The 1658 cm−1 band indicates α helix content. Curve 1: 50% heat-denatured then freeze-dried. Curve 2: no excipient; 3: HES (1:1 protein: excipient); 4: stachyose (1:1); 5: trehalose (1:1); 6: trehalose (1:6) [44].
Reproduced with permission
