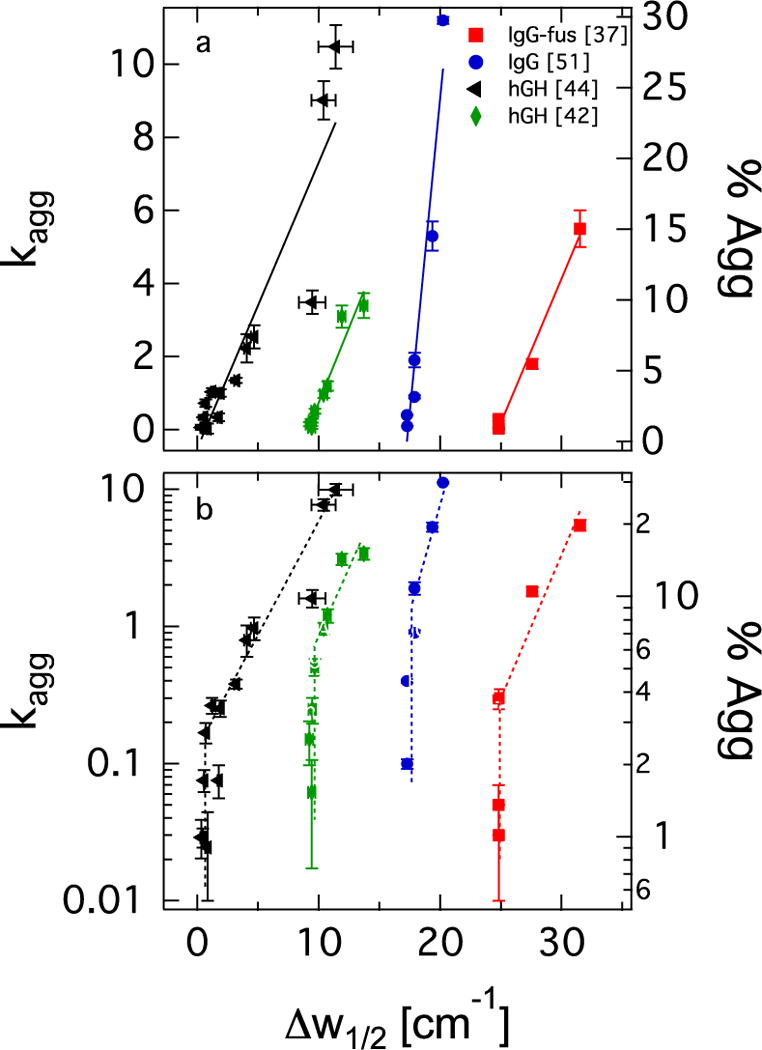
Fig. 2.

Correlation between spectral width and degradation rates: a) Linear ordinate and best linear fits to data. hGH data plotted against Δw1/2 of 1658 cm−1 α helix marker band [44,46], and IgG data plotted against Δw1/2 of 1640 cm−1 β sheet marker band [39,53]. b) Same data as in a), but plotted against logarithmic ordinate. Dashed lines are guides to the eye.
