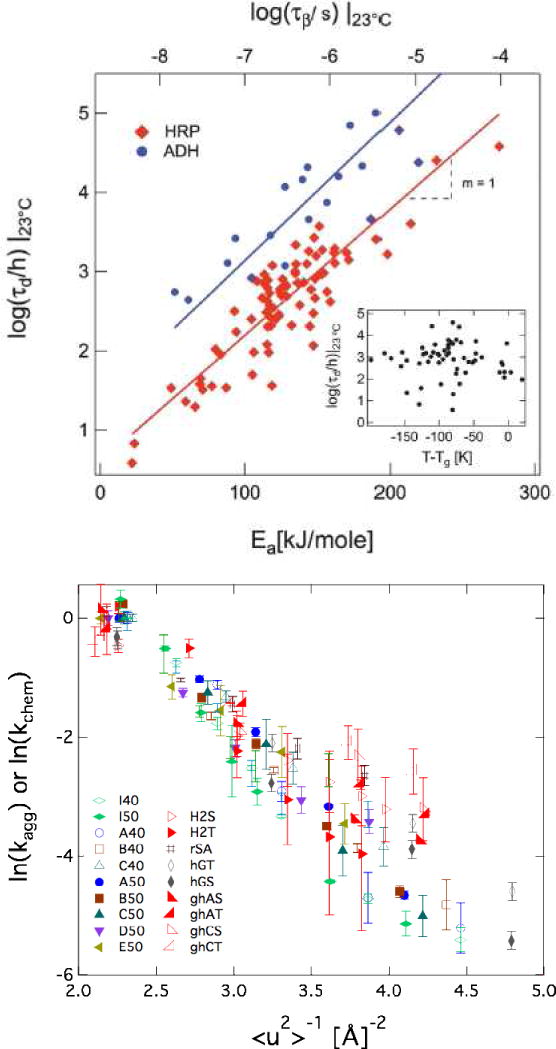
Fig. 4.

Correlation between stability and β relaxation processes: a) Enzyme degradation rates at 23 °C in >100 plasticized and antiplasticized sugar-glasses. The solid lines are best fits to the data and yield a slope near 1. Inset: T–Tg for most of the glasses shown in the main figure. b) Aggregation and chemical degradation rates of proteins freeze-dried in sucrose or trehalose-based glasses plotted as a function of <u2>−1. Each symbol represents a distinct temperature – protein – disaccharide combination. See reference [76] for details. Reproduced with permission.
