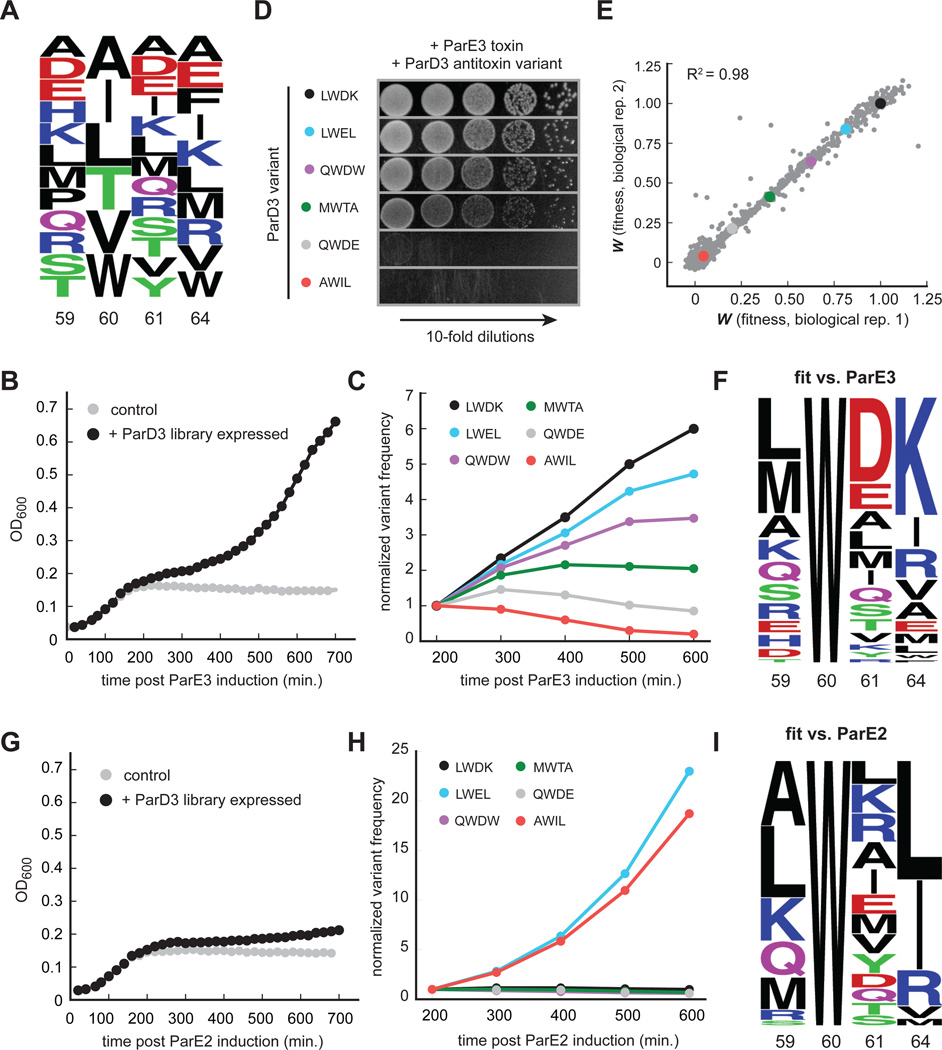
Figure 4. High-throughput mapping of mutant fitness at co-evolving interface.
(A) Composition of the ParD3 antitoxin library at the four variable positions.
(B) Library growth following ParE3 toxin induction.
(C) Frequency changes over time for the indicated ParD3 variants following ParE3 induction.
(D) Testing of individual variants from (C) using the toxicity rescue assay. 10-fold serial dilutions were plated from cultures expressing the ParD3 variant indicated and the ParE3 toxin.
(E) Two biological replicates of fitness measurements derived from screening the ParD3 library against the ParE3 toxin.
(F) Frequency logo for ParD3 library variants with high fitness against ParE3 (WE3 > 0.5).
(G) Library growth following induction of the non-cognate ParE2 toxin.
(H) Frequency changes over time for the indicated ParD3 library variants.
(I) Frequency logo for ParD3 library variants with high fitness against ParE2 (WE2 > 0.5).
Also see Fig. S4.

