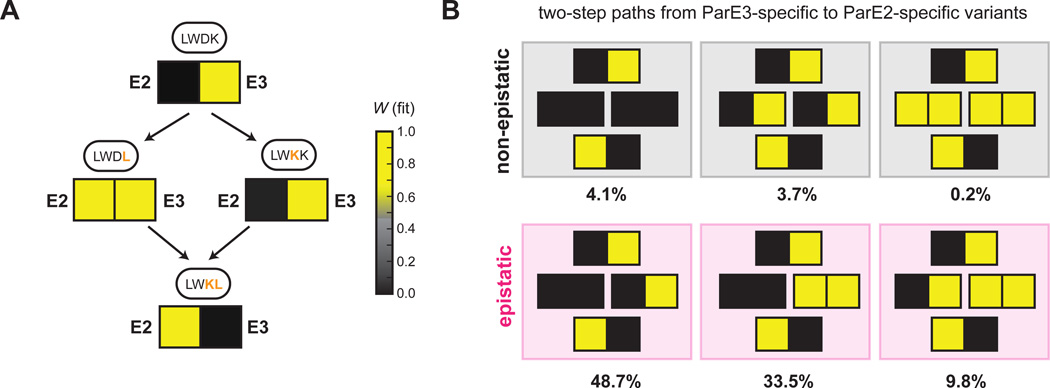
Figure 6. Mutational order dictates specificity class of intermediate variants.
(A) Mutational paths from LWDK to LWKL for ParD3 with fitness of each variant against ParE2 and ParE3 shown as a heatmap: yellow, high fitness; black low fitness.
(B) The six path types that reprogram ParD3 specificity in two mutational steps. Percentage of mutational paths in each category is indicated for a threshold of 0.5 used to define a positive interaction.
Also see Fig. S6.

