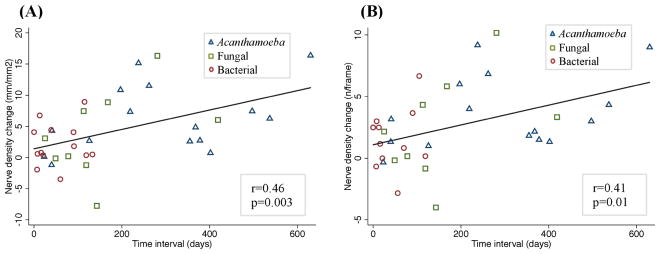
Figure 5.

Scatter plot showing the correlation between the subbasal corneal nerve alterations over time. A significant positive correlation was found between the changes in total nerve length (A) and total number of nerve (B) with the time interval between the time points. Spearman’s correlation coefficient was used.
