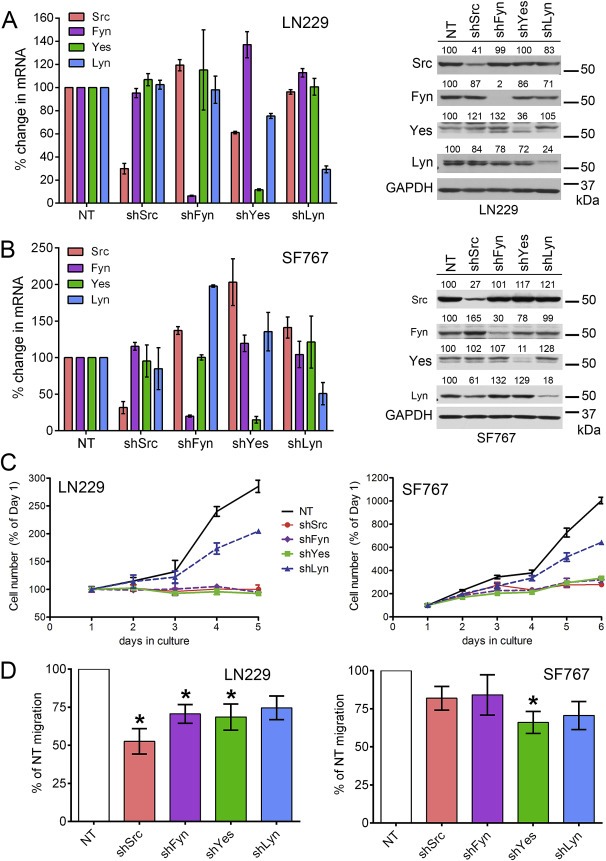
Figure 2.

Differential effect of individual Src‐family kinase knockdown on glioma cell line growth and migration. (A) Non‐target (NT) shRNA or shRNA targeted to each of four SFKs (Src, Fyn, Yes, and Lyn) were expressed in LN229 cells. (left panel) QPCR was used to evaluate mRNA levels of all four SFKs in the context of individual SFK knockdown. The selected SFK shRNAs are specific for the mRNA of their targeted kinase without affecting the mRNA levels of the other three kinases. (right panel) Protein expression of all four SFKs in the context of individual SFK knockdown was evaluated by western blot. Numbers above each of the four SFK blots indicate expression relative to the NT lysate (% of NT) and are normalized to GAPDH expression. The blots confirm that each SFK shRNA specifically reduced the protein expression for that kinase with minimal effects on protein levels of the other three kinases. (B) As in (A), but in the context of SF767 cells, confirming that the specificity of the selected shRNAs is cell‐line independent. (C) The effect of individual SFK knockdown on LN229 (left) and SF767 (right) growth in culture varies. LN229‐shSrc, ‐shFyn, and ‐shYes cell number is significantly different from –NT at 3, 4, and 5 days in culture (p < 0.001); LN229‐shLyn is significantly different from –NT at 4 and 5 days in culture (p < 0.001). SF767‐shSrc, ‐shFyn, and ‐shYes cell number is significantly different from –NT at 3, 4, 5, and 6 days in culture (p < 0.001); SF767‐shLyn is significantly different from –NT at 5 and 6 days in culture (p < 0.001). Representative graphs of n = 3 experiments are shown; error bars are SD. (D) The effect of individual SFK knockdown on LN229 (left) and SF767 (right) transwell migration toward media containing 0.5% FBS varies. Migration quantification is normalized to the number of –NT cells that migrated in a particular experiment (set to 100% for each experiment). Error bars are SEM; the data is a combination of n = 4 independent experiments. *significantly different vs. NT (p < 0.05).
