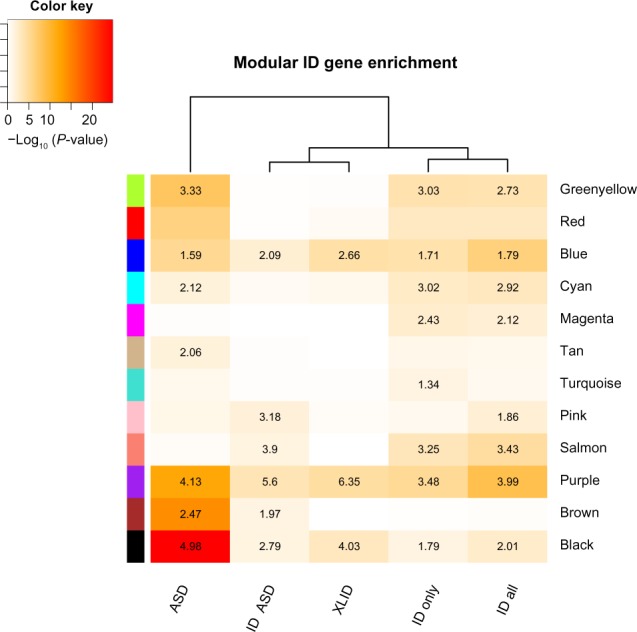
Figure 1.

ID gene enrichment in coexpression modules. ID gene overrepresentation is shown in a heat map displaying the −log10 adjusted P-values of the Fisher’s exact test. Odds ratio values are overlaid onto the heat map if they are >1. Only modules with an adjusted P-value of <0.05 in at least one gene set are displayed, resulting in 12 out of the 16 modules shown.
