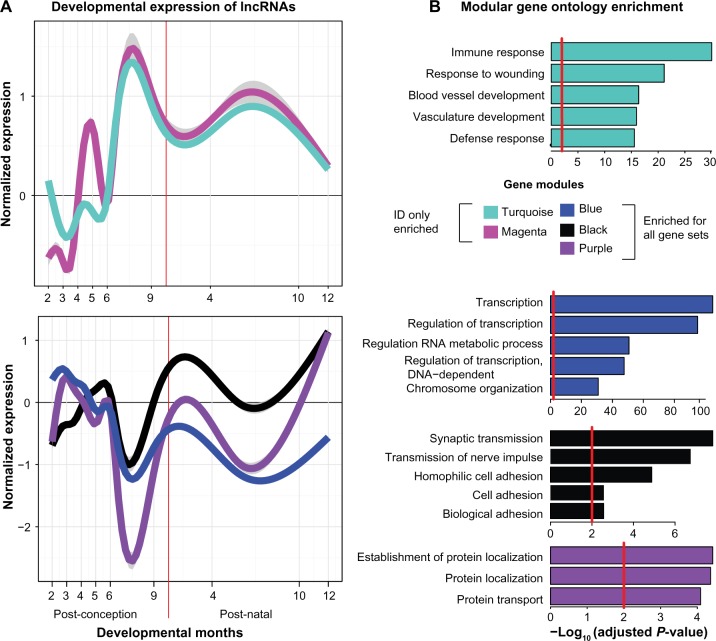
Figure 2.
Characteristics of ID-gene-enriched coexpression modules. (A) The gene expression of lncRNAs from eight weeks postconception to one postnatal year, grouped by module, was normalized and plotted across developmental time using a scatter smoothing function. The shaded adjacent regions represent 95% confidence intervals. (B) Gene functional enrichment was analyzed using the Database for Annotation, Visualization and Integrated Discovery (DAVID, available at https://david.ncifcrf.gov/), and the top five Gene Ontology terms of biological processes were displayed. The red vertical lines represent the significance threshold of P-value = 0.01.

