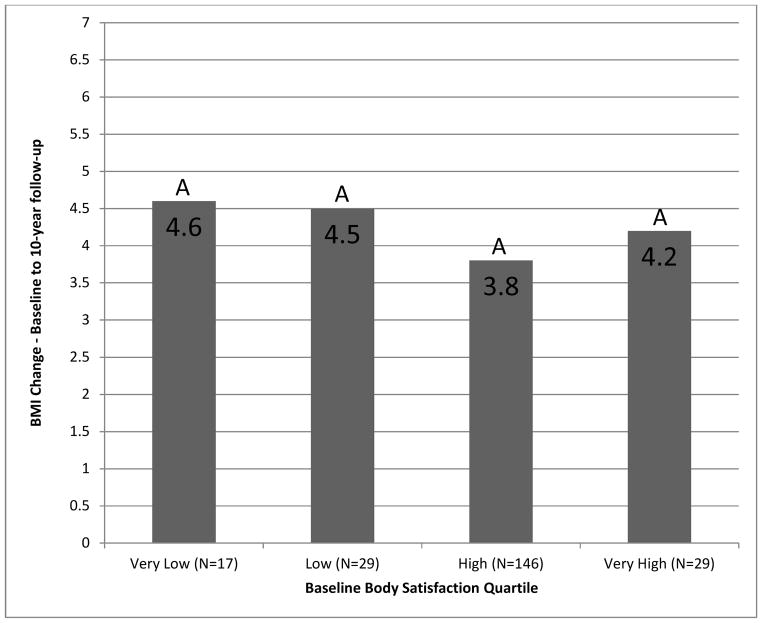
Figure 2.
Adjusted mean BMI change between baseline and 10-year follow-up, by baseline body satisfaction quartiles in overweight adolescent boys
Notes: 1) Models adjusted for continuous BMI at baseline, age, age squared, SES, and Race/Ethnicity, 2) All models are weighted for differential non-response, 3) Different letters above each bar indicate statistically significant differences observed between bars. Statistically significant difference set at p<0.05 level.

