Fig. 1.
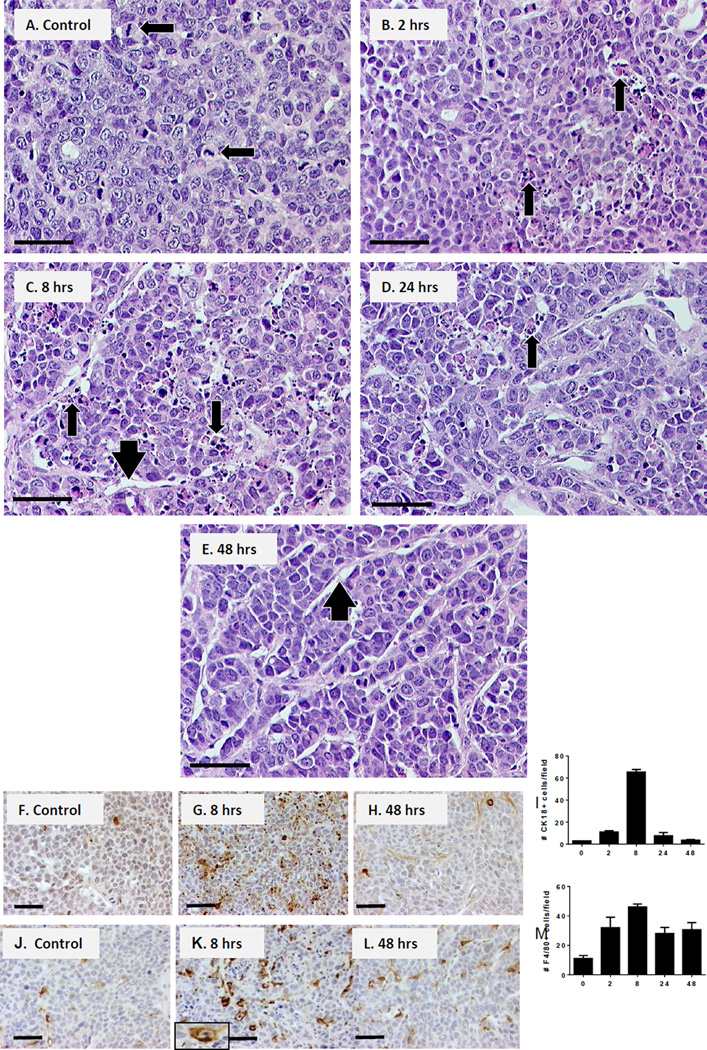
Kinetics of apoptosis induced in human Colo205 xenografts by a single Apo2L/TRAIL treatment. (A–E) H&E sections post-treatment: (A) Control, tumors are compact with mitotic figures (arrows); (B) at 2 hrs foci of apoptosis are seen (arrows); (C) at 8 hrs widespread areas of apoptotic bodies and cellular debris are evident (arrows) and stromal areas are wider (arrowhead); (D) at 24 hrs debris remnants are seen (arrow) and (E) at 48 hrs post-treatment, the debris is cleared and the tumor microenvironment appears less compact (arrowhead). (F–I) IHC for apoptotic cells (cleaved cytokeratin18+ cells); bar graph indicates average number of cells in 3 fields. (J–M) IHC for macrophages (F4/80+ cells); bar graph indicates average number of cells in three fields. Bar= 50µm

