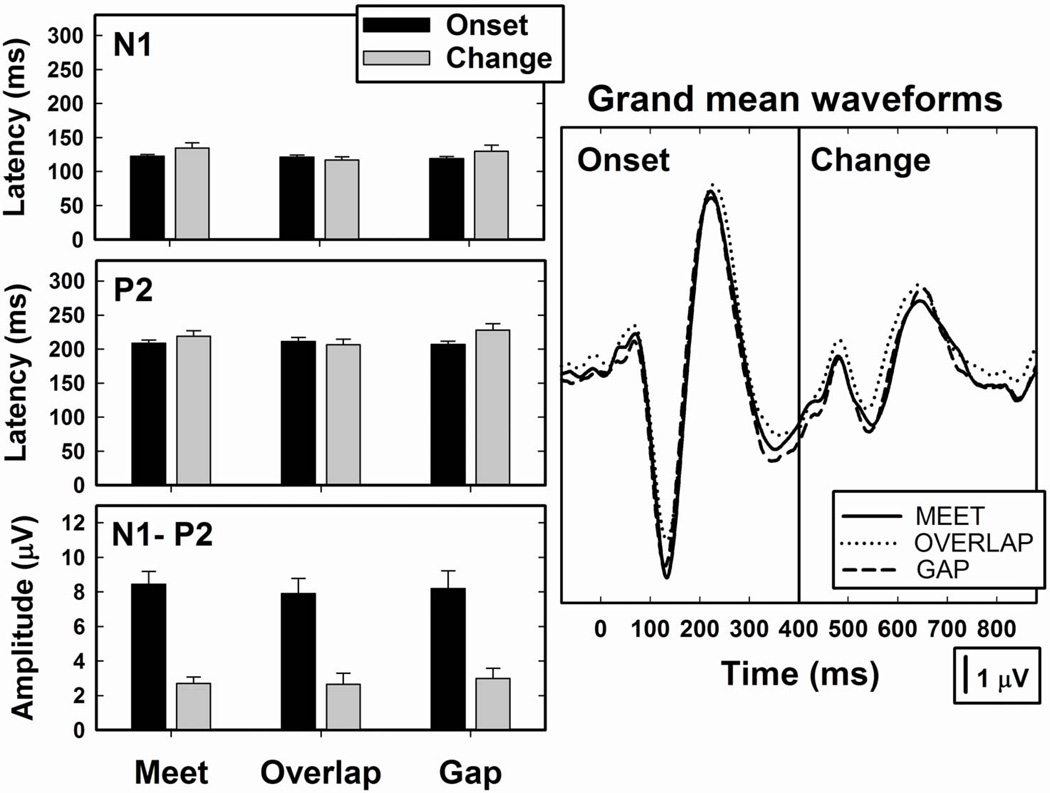
Figure 3.
Grand mean waveforms constructed using data from all 10 Hybrid CI users are shown. The parameter is the programming strategy: Meet, Overlap, Gap. The bar graphs show mean peak latency and peak-to-peak amplitude values (+ 1 SE) for both the onset and change responses. The results reflect the average of responses recorded using both the /u-i/ and /i-u/ stimulus pairs.

