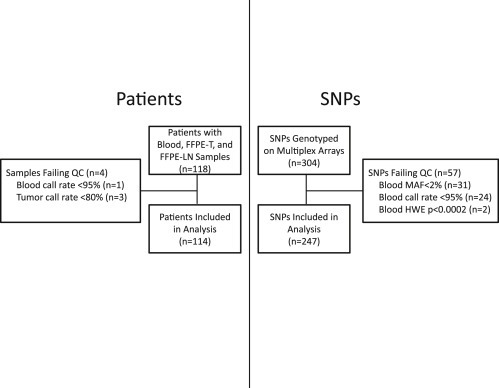
Figure 1.

Consort Diagram for Patients and SNPs. Quality control filtering of patients whose samples failed genotyping in blood or tumor (left) and SNPs that failed genotyping in blood (right). After quality control 114 patients with matched blood, FFPE‐T and FFPE‐LN samples genotyped for 247 independent SNPs were included in the analysis. Footnote: Abbreviations: MAF: Minor allele frequency, HWE: Hardye—Weinberg Equilibrium.
