
Figure 2.
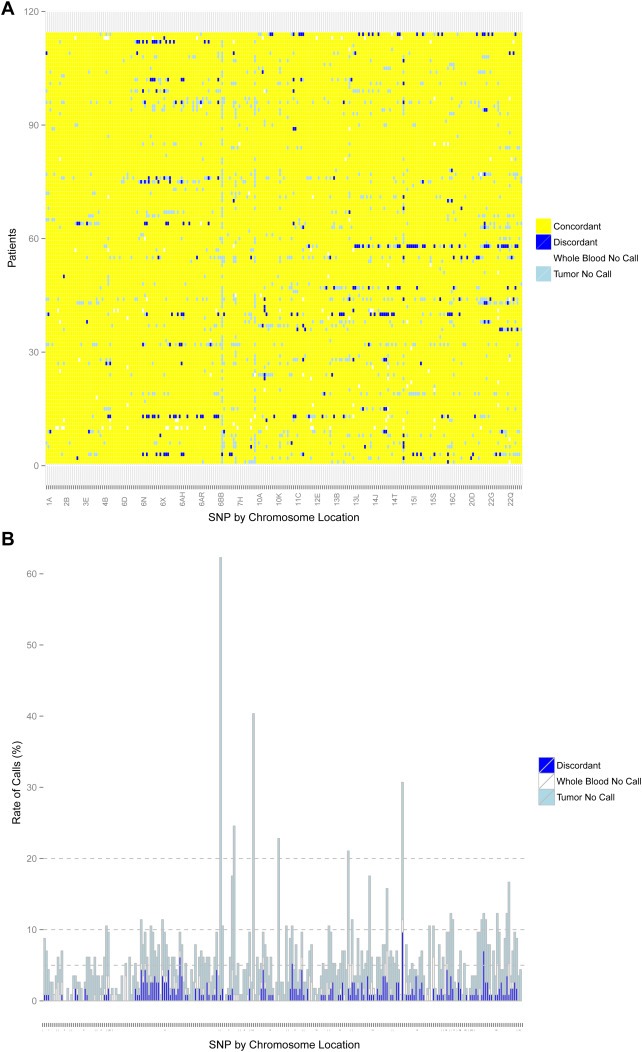
Genotyping for FFPE‐T. Concordance between FFPE‐T and blood for all patients (n = 114) and SNPs (n = 247) that passed quality control. (A) Discordant calls (blue) and no‐calls in either the tumor (light blue) or blood (white) are represented by colors. (B) The number of possible discordant calls (strict discordant calls plus no‐calls in tumor or blood) for all SNPs with stacked bars colored similarly to Figure 1A. The horizontal lines indicate cutoffs of 5%, 10%, and 20%. Overall, the tumor genotyping was highly concordant with few SNPs that failed FFPE‐T genotyping.