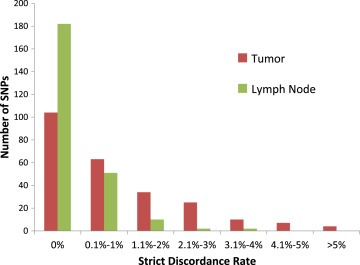
Figure 3.

Strict discordance rates for FFPE‐T and FFPE‐LN. Histogram of the strict discordance rates in FFPE‐T and FFPE‐LN, each compared with blood, for all SNPs included in the analysis. Overall the discordance rates were quite low, with very few SNPs having more than 1% discordant calls between either tissue of interest and blood.
