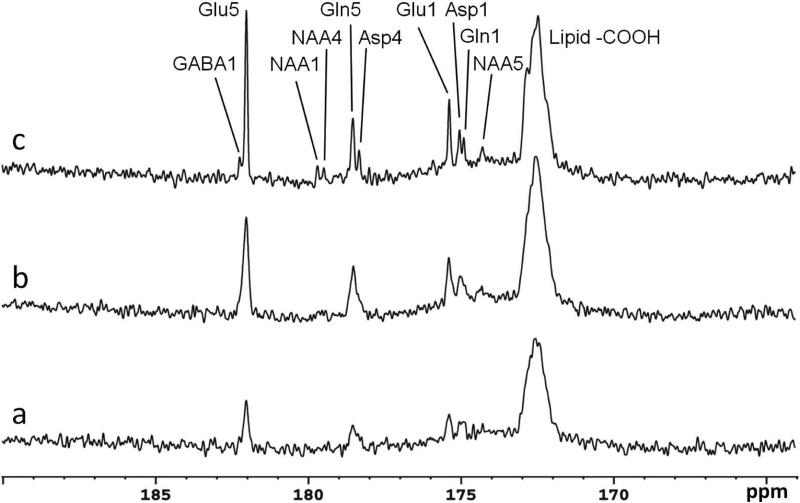
Figure 6.
Spectra obtained from a healthy volunteer under the following conditions: (a) with neither NOE nor decoupling, (b) with NOE only, and (c) with both NOE and decoupling. Each spectrum was acquired with TR = 5 s, NA = 104, BW = 5 kHz, data point = 1024, and processed with LB = -3.0 Hz and GB = 0.2. The spectra were collected over the time period from 60 min to 100 min after [2-13C]glucose infusion began. Using the peak amplitude of glutamate C5 (Glu5) in Fig. 6a as a reference, the peak amplitude of glutamate C5 was increased on average, by a factor of 2.3 when NOE was on (Fig. 6b), and by a factor of 4.3 when both NOE and decoupling were on (Fig. 6c). Asp4, aspartate C4; Asp1, aspartate C1; GABA1, gamma-aminobutyric acid C1; Gln1, glutamine C1; Gln5, glutamine C5; Glu1, glutamate C1; Glu5, glutamate C5; NAA, Nacetylaspartate.

